- Research
- Open access
- Published:
Portfolio diversification benefits of alternative currency investment in Bitcoin and foreign exchange markets
Financial Innovation volume 7, Article number: 17 (2021)
Abstract
This study examines the portfolio diversification benefits of alternative currency trading in Bitcoin and foreign exchange markets. The following methods are applied for the analysis: the spillover index method of Diebold and Yilmaz (Int J Forecast 28(1): 57–66, 2012. https://doi.org/10.1016/j.ijforecast.2011.02.006), the spillover asymmetry measures of Barunik et al. (J Int Money Finance 77: 39–56, 2017. https://doi.org/10.1016/j.jimonfin.2017.06.003), and the frequency connectedness method of Barunik and Křehlík (J Financ Econom 16(2): 271–296, 2018. https://doi.org/10.1093/jjfinec/nby001). The findings identify the presence of low-level integration and asymmetric volatility spillover as well as a dominant role of short horizon spillover among Bitcoin markets and foreign exchange pairs for six major trading currencies (US dollar, euro, Japanese yen, British pound sterling, Australian dollar, and Canadian dollar). Bitcoin is found to provide significant portfolio diversification benefits for alternative currency foreign exchange portfolios. Alternative currency Bitcoin trading in euro is found to provide the most significant portfolio diversification benefits for foreign exchange portfolios consisting of major trading currencies. The findings of the study regarding spillover dynamics and portfolio diversification capabilities of the Bitcoin market for foreign exchange markets of major trading currencies have significant implications for portfolio diversification and risk minimization.
Introduction
The detached behavior of Bitcoin price formation from economic fundamentals makes Bitcoin a significant portfolio diversification instrument for conventional and alternative investment assets with ability to withstand financial downturns. The published research on Bitcoin has identified the varying nature of efficiency among alternative currency Bitcoin markets (Sensoy 2019). This finding is relevant for portfolio diversification, as the presence of arbitrage opportunities among alternative currency Bitcoin markets can be utilized by profit-maximizing investors to enhance portfolio returns (Makarov and Schoar 2020). Similarly, Stensås et al. (2019) found that Bitcoin has hedging benefits for developing countries, such as Brazil, India, South Korea, and Russia, and diversification benefits for developed countries and commodities. In line with the findings of Stensås et al. (2019), Omane-Adjepong and Alagidede (2020) found a varying nature of portfolio diversification and hedging capabilities of Bitcoin and Ripple for emerging markets’ assets. Specifically, diversification and hedging benefits of Bitcoin and Ripple varied across emerging asset classes, country-specific assets, and regional emerging markets. Bitcoin has also been found to provide value-added diversification for portfolios of traditional assets (Platanakis and Urquhart 2019), as indicated by the presence of detached price behavior of Bitcoin from these traditional assets. Bitcoin price movement has also been found to affect national currency markets (Kyriazis 2019b). Thus, it is important to study the varying nature of volatility spillover and portfolio diversification benefits that alternative currency Bitcoin trading can offer investors. The currency of trade for Bitcoin is an important determinant of price differences at different alternative currencies’ Bitcoin exchanges (Brandvold et al. 2015), which in turn is highly likely to affect the foreign exchange rate (Narayan et al. 2019). The presence of diversity among Bitcoin prices at different alternative currencies’ exchanges (Briere et al. 2015; Fry and Cheah 2016) and the presence of price bubbles in the Bitcoin market (Cheah and Fry 2015; Cheung et al. 2015) motivates us to investigate the volatility spillover from the Bitcoin market to the foreign exchange pairs of six major trading currencies.Footnote 1 To date, little attention has been paid to the analysis of volatility spillover dynamics between alternative currency Bitcoin and foreign exchange markets.
Measuring spillover from Bitcoin to other financial markets is important to understand its portfolio diversification capabilities and its ability to withstand financial downturns. A differing influence of Bitcoin has been found for the Japanese yen, British pound sterling, Swiss franc, euro, Australian dollar, and Canadian dollar. Bitcoin has been found to act as a hedge for the Swiss franc, euro, and British pound sterling, and as a diversifier for the Australian dollar, Canadian dollar, and Japanese yen (Urquhart and Zhang 2019). The varying efficiency, arbitrage, hedging, and portfolio diversification opportunities across Bitcoin exchanges denominated in different currencies provide the motivation for empirically analyzing whether Bitcoin currency denomination alters the portfolio diversification benefits of Bitcoin.
With an aim to fill the existing void in the literature, this study investigates volatility spillover from the Bitcoin market to the foreign exchange pairs of six major trading currencies (US dollar, euro, Japanese yen, British pound sterling, Australian dollar, and Canadian dollar) for the period September 17, 2014 to December 31, 2018. This study employs the Diebold and Yilmaz (2012) spillover index, the Barunik et al. (2017) spillover asymmetry measure, and the Barunik and Křehlík (2018) frequency connectedness methodology. This study contributes to the emerging research literature by achieving the following three objectives. First, this study provides empirical evidence on the dynamics of time-varying average volatility spillover from the Bitcoin market to the foreign exchange pairs of six major trading currencies during the analyzed sample period. Second, this study provides evidence on the nature of static and time-varying dynamic asymmetric volatility spillover from the Bitcoin market to the foreign exchange pairs of six major trading currencies. Analysis of asymmetric volatility spillover yields knowledge on how negative and positive volatility in a market influences positive and negative volatility in other markets. Third, this study investigates the dynamic frequency connectedness of the Bitcoin market to the foreign exchange pairs of six major trading currencies to reveal the dynamics of volatility spillovers at short and long horizon frequency domains. The frequency connectedness measures provide evidence on the speed and horizon of volatility spillover dynamics across the analyzed markets.
Analysis and forecasting of volatility spillover dynamics among integrated conventional and alternative investment assets is of primary importance in the field of finance research. The estimates of volatility spillover are needed for formulating portfolio optimization, hedging and risk minimization strategies by investors and policymakers. To date, little is known about the volatility spillover dynamics of Bitcoin markets and foreign exchange pairs denominated in major trading currencies. The findings of this study provide significant insight for investors, policymakers, and researchers by revealing the influence of Bitcoin as an alternative investment on other financial markets. By quantifying the interconnectedness relationship among Bitcoin markets and foreign exchange pairs denominated in six major trading currencies yields a deeper understanding of future spillover and contagion, which could be used to formulate educated investment strategies about whether to include Bitcoin in an investment portfolio or not. A clear understanding of the nature and dynamics of volatility spillover among the Bitcoin markets and foreign exchange pairs denominated in six major trading currencies would help investors to better align their investment strategies and policies to counter adverse conditions in any of the analyzed markets. Investors could also benefit from the price discrepancy that exists in Bitcoin trading in alternative currencies and could utilize this discrepancy for portfolio optimization. For scholars, an interesting avenue for further research would be to investigate the relationship between cryptocurrencies and conventional and alternative investment assets. Lastly, this study helps policymakers to obtain better insights into how Bitcoin price movements will be affecting the financial system in the future and thereby formulate strategies to curtail the negative impacts of such price movement on the existing financial system and institutions.
The remainder of paper is organized as follows. "Literature review" section covers the relevant literature review for the topic. "Methodology" section explains the research methodology. "Data and descriptive" section describes the data. "Results and discussion" section presents the results and discusses them. The last section concludes.
Literature review
Academic research on cryptocurrencies started with Bitcoin, the first cryptocurrency and mainly focused on analysis of legal, security, and technical features of Bitcoin’s block chain technology. Among them, the works of Barber et al. (2012) and Tu and Meredith (2015) are most prominent. Priem (2020) analyzed the merits and demerits of distributed ledger technology and suggested that regulatory risk exists and needs to be addressed. Meralli (2020) introduced the zkABS technique, based on cryptographic zero knowledge proof, which allows better analysis of price risk and fraud. Later, due to the high price growth of Bitcoin, researchers focused on analyzing other aspects of Bitcoin, such as price formation, efficiency, speculative nature, and financial aspects for portfolio diversification. Over time, support for and criticism of acceptance of Bitcoin have become a major topic of debate in the research community.
Regarding the price determinants of Bitcoin, researchers have found that Bitcoin prices exhibit detached behavior that cannot be explained by economic fundamentals (Bouoiyour and Selmi 2015; Dastgir et al. 2019; Kristoufek 2013; Polasik et al. 2015).Footnote 2 Kristjanpoller and Bouri (2019) analyzed the price behavior of cryptocurrencies relative to conventional currencies and found the presence of significant multifractal behavior in Bitcoin price movement. Researchers have also studied the price efficiency for Bitcoin markets to uncover arbitrage opportunities that may exist due to the presence of inefficiency in the Bitcoin market. Nam et al. (2006) found that such factors as liquid alternative currency indexes, a new futures exchange, and reduction of intra-day volatility explain cryptocurrency market efficiency.
Fassas et al. (2020) analyzed the contribution of the Bitcoin futures market to price discovery in the Bitcoin market. The authors established the existence of a bidirectional relationship between intra-day volatility in Bitcoin futures and spot markets. The authors also provided evidence for the influence of Bitcoin futures market on price formation in the Bitcoin spot market. Fink and Johann (2014) argued that Bitcoin prices experience extreme returns and high volatility, and that the Bitcoin market is informationally inefficient. Klein et al. (2018) found that the increase in Bitcoin prices is the major factor contributing to increased Bitcoin volatility and that Bitcoin prices are expected to decline in future as speculative investors aim to take advantage of the existing price. Gronwald (2019) also found that volatility in Bitcoin price is mainly influenced by large price movements, and the effect of price movement on volatility is larger in the Bitcoin market than in crude oil and gold markets. Urquhart (2016) also claimed that, after an initial transitory phase, as the market matures, Bitcoin was in the process of moving toward efficiency. Bariviera (2017) reported that Bitcoin daily returns exhibited persistent behavior before 2014, whereas the behavior was more efficient after 2014. Vidal-Tomás et al. (2019) analyzed the efficiency in Altcoin markets and found the presence of a weak form of inefficiency. The authors concluded that the efficiency of the Altcoin market had decreased over time, especially in 2017, and that introduction of new Altcoin did not help to increase the level of efficiency in the market.
On the contrary, Sensoy (2019) testing weak form efficiency in the Bitcoin US dollar and euro market, found that efficiency existed in these markets and that Bitcoin trade in US dollars exhibited more efficient behavior than Bitcoin trade in euro. Nadarajah and Chu (2017) concluded that Bitcoin returns were efficient. Similarly, Tiwari et al. (2018) found evidence for the informational efficiency of the Bitcoin market.Footnote 3 Makarov and Schoar (2020) established the presence of deviation in cryptocurrency traded over different online exchanges that persisted for several days and suggested that inefficiency was present across alternative currency Bitcoin exchanges. Similar results for the presence of inefficiency in Bitcoin market were found by Kyriazis (2019a). Jalali and Heidari (2020) employed a grey prediction model to forecast Bitcoin prices and found that the GM (1, 1) model provides better price forecasts within a 5-day window. The basic argument that Bitcoin prices are inefficient, without any fundamental relationship to macroeconomic and financial variables, has triggered another strand of studies examining the speculative nature of Bitcoin.
Glaser et al. (2014) questioned the motivations behind the implementation of Bitcoin and highlighted the resemblance of its exchange activities to pure speculative trading. Kristoufek (2015) proposed that the unexplained nature of Bitcoin’s price by economic theory makes it a pure speculative investment asset, where the main driver for price formation is investors’ speculation. Cheung et al. (2015) and Corbet et al. (2018) provided further evidence on the speculative nature of Bitcoin investment by identifying the presence of speculative price bubbles in the Bitcoin market. Phillip et al. (2018) argued that a US dollar 1000 investment in Bitcoin during 2010 was equal to US dollar 81 million in 2017. Katsiampa (2019) suggested that the gigantic fluctuations in Bitcoin prices depict their increasing use for speculative purposes. Baur et al. (2018) argued that Bitcoin markets were inefficient and supported the speculative nature of Bitcoin investment.
Speculation and spillover are closely related phenomena, as the former can give birth to the latter (Phillips and Yu 2011). Bouri et al. (2018) analyzed the spillover behavior between Bitcoin and conventional assets during bull and bear markets and found evidence of asymmetry in the two market conditions. Similarly, Zhang et al. (2020) found evidence for significant downside between Bitcoin, equity, bond, currency, and commodity markets. Baur et al. (2018) recommended that the integration among Bitcoin and financial markets can be explained considering its usage system. The usage of Bitcoin as a medium of exchange to purchase goods and services is likely to affect the US foreign exchange market. Meanwhile, if Bitcoin is utilized as an investment vehicle, the stock, bond, and commodity markets are likely to be affected. The findings of Baur et al. (2018) also identified Bitcoin as a speculative investment asset, raising alarm about spillover and contagion among Bitcoin and financial markets. Selgin (2015) identified Bitcoin as synthetic commodity money, sharing the features of gold and US dollars. Gold is used as an investment vehicle, whereas, US dollars are the major medium of exchange for the purchase of goods and services. Thus, in line with Baur et al. (2018), Selgin (2015) provided significant rationale for investigating Bitcoin contagion and spillover effects with other financial assets after its phenomenal growth. Narayan et al. (2019) analyzed the impact of Bitcoin speculative price growth on the inflation, currency appreciation, and velocity of money in the Indonesian economy. The findings indicated significant influence of Bitcoin price growth on inflation, currency appreciation, and reduced velocity of money. The authors attributed this significant effect to the wealth effect generated by Bitcoin price growth.Footnote 4
Richardson (2014) argued that, despite its speculative nature, Bitcoin was gaining importance as an investment alternative due to its similar portfolio diversification characteristics to alternative investment instruments. Hakim das Neves (2020) identified the safe heaven characteristics of Bitcoin in times of global crisis and considered it an alternative investment for global investors. Bitcoin also provided attractive features, like high speed and low-cost transactions, compared to traditional payment methods. Feng et al. (2018) identified the presence of informed trading in Bitcoin US dollar market, whereby informed traders make significant profits on their private information ahead of cryptocurrency-related events. The authors attributed such informed trading to the unregulated environment of cryptocurrency markets. Bitcoin transactions, unlike those in the traditional payments system, do not require intermediaries (Chiu and Koeppl 2019). Kovanen (2019) argued that the growing interest of speculative investors in cryptocurrency trading and the digitalization of currencies around the world are likely to encourage central banks to accept cryptocurrencies as mainstream currencies. Brandvold et al. (2015) found that the currency of trade for Bitcoin was an important determinant of the price differences in different alternative currencies’ Bitcoin exchanges, which could provide significant value addition for speculative investors and portfolio diversification.
Similarly, Makarov and Schoar (2020) found the existence of deviation in cryptocurrencies’ price across countries and suggested that arbitrage opportunities were present in alternative currency cryptocurrency trading. Dyhrberg (2016) found that Bitcoin possesses significant hedging benefits similar to gold for FTSE index stocks and the US dollar, whereas Bouri et al. (2017a) found Bitcoin to be a significant hedge against global uncertainty over a short horizon. Bitcoin was also found to provide portfolio diversification benefits for stocks, bonds, and commodity portfolios (Platanakis and Urquhart 2019). Corbet et al. (2019) argued that despite the questions raised about the unregulated and underdeveloped cryptocurrency market, it was considered to be a financial asset by many investors for portfolio diversification. Platanakis et al. (2018) examined naïve and optimal portfolio diversification techniques in the cryptocurrency market and found little performance difference in the two construction techniques. Antonakakis et al. (2019) found evidence of hedging capabilities during a crisis period for cryptocurrency markets. Guesmi et al. (2019) and Qarni et al. (2019) also found evidence of hedging and portfolio diversification for Bitcoin investment against investment risk. Katsiampa (2019) provided evidence based on optimal portfolio weights and found that Bitcoin outweighs Ether as a means of portfolio diversification. Beneki et al. (2019) analyzed the volatility spillover between Ethereum and Bitcoin markets and found the existence of delayed response in the Bitcoin market to volatility shocks in the Ethereum market. The authors also concluded that this behavior in the Bitcoin market left room for speculative profit-making opportunities in the Bitcoin market. Portfolio diversification benefits of cryptocurrencies were also found by Fang et al. (2020), who stated that portfolio diversification through cryptocurrencies could be achieved by including cryptocurrencies in portfolios of global stocks and futures. Urquhart and Zhang (2019) proposed that Bitcoin is an effective hedge instrument for the euro, Swiss franc and British pound sterling, whereas for the Japanese yen, Canadian dollar, and Australian dollar, it is an effective portfolio diversifier. Similarly, Liu (2019) found the presence of portfolio diversification benefits for cryptocurrencies by inclusion with traditional asset classes. Meanwhile, Kyriazis (2019b) found Bitcoin to be the most significant transmitter and receiver of volatility spillover to and from other cryptocurrencies. The author found that volatility spillover transmission was present among Bitcoin and global national currencies.
Bouri et al. (2017b) found that Bitcoin provides a low hedge for major world stock indexes, bond, oil, gold, commodities, and the US dollar. However, the author found that Bitcoin was a significant diversifier for the aforementioned conventional and alternative investments. The ongoing debate and the presence of mixed evidence regarding the Bitcoin market’s efficiency, speculative nature, and portfolio diversification capabilities highlight the continued existence of a research gap that requires further analysis. Past research has also highlighted the presence of varying efficiency across Bitcoin exchanges denominated in alternative currencies. This finding has significant portfolio diversification benefits that need to be explored.
Existing studies on the spillover dynamics of Bitcoin denominated in alternative currencies is scarce; most studies have focused on Bitcoin price data for a single currency, mainly the US dollar, or the weighted average price for Bitcoin. Similarly, for foreign exchange pairs, researchers have analyzed the foreign exchange of currencies against a single currency, mainly the US dollar, or the weighted average exchange rate against a group of currencies, thereby limiting evidence on the portfolio diversification benefits of alternative currency exchange rates. The present study covers this research gap on the unexplained nature of volatility spillover from the Bitcoin market to the foreign exchange pairs denominated in six major trading currencies. In this study, we expand the existing research by including Bitcoin price data for six major trading currencies, and cross-currency foreign exchange rates for six major trading currencies. This provides a more comprehensive dataset for analysis of spillover and contagion dynamics from the Bitcoin market than the existing literature.
Methodology
In the past, many methods have been developed to investigate and measure spillover and contagion among conventional and alternative investment assets and markets (Gulzar et al. 2019). Derived from the Markowitz (1952) portfolio theory, correlation among conventional and alternative investment assets was considered as a major measure and transmission channel for spillover and contagion. However, this method was not free from criticism. The argument in favor of the contagion effects of crisis was criticized by some researchers based on the fact that these correlations were not adjusted for heteroskedasticity. If the correlations among the economies in the event of crisis were adjusted for the effect of heteroskedasticity, the result would show no increase in the correlation among the economies during the crisis event. Rather, it can be interpreted as the existence of interdependence among the economies (Basu 2002; Bordo and Murshid 2001; Forbes and Rigobon 2002). To overcome the deficiencies of the correlation model as a measure of spillover and contagion, multivariate GARCH models were developed but were also not free of flaws. The estimates of the BEKK-MGARCH model (Engle and Kroner 1995) do not provide a straightforward interpretation for the magnitude and direction of spillover and contagion due to the model’s non-linear measurement properties. On other hand, the constant conditional correlation model (Bollerslev 1990) provides a constant conditional correlation (CCC) measure for the entire sample period analyzed, which contradicts reality, as conditional correlation does not remain constant over time. Thus, to capture the dynamic nature of conditional correlation among asset prices, a dynamic conditional correlation multivariate GARCH (DCC MGARCH) model was developed. The DCC MGARCH model provided a single measure of spillover and contagion for the entire set of economies, making it vague with respect to identifying the direction and magnitude of spillover among individual markets (Engle and Sheppard 2001). The criticism on the past research regarding contagion literature leaves room for further analyses on the topic.
Over time researchers have improved the methodological tools on the existence of contagion among interlinked economies. Diebold and Yilmaz (2009) developed a spillover index method to estimate the spillover among global equity markets but it is flawed, as the results depend on the ordering of the variables. The dependence of results on the ordering of the variables was eliminated by Diebold and Yilmaz (2012), who provided measures to estimate the average static and dynamic spillover, along with directional and pairwise measures of spillover. This also allows estimation of time-varying dynamics of spillover for conventional and alternative investment assets. Diebold and Yilmaz (2012) provided only an aggregate measure of volatility spillover but could not analyze the separate influence of positive and negative spillover. The concept of asymmetric spillover was introduced by Barunik et al. (2015), by estimating separate N-variable vector autoregressive (VAR) models for positive and negative spillover. This method measured the isolated influence of positive volatility on positive and negative volatility on negative volatility only. However, it is significant to include the effect of negative volatility on positive volatility and vice versa. Barunik et al. (2017) extended the method by applying a single VAR model of 2N variables that includes both positive and negative volatilities for each variable. This model provides a more accurate measure for studying the influence of positive and negative volatility spillover in financial and alternative asset markets. Barunik et al.’s (2017) method accounts for the influence of positive and negative volatility only at aggregate frequency level; however, micro-analysis of spillover under the time frequency domain is very important to understand the speed of spillover transmission among integrated markets. Barunik and Krehlik (2016) provided a method to measure the estimates of spillover under time frequency domains. This method was further extended by Barunik and Křehlík (2018) to provide better estimates of frequency connected under time frequency domains.
With these attractive features, the joint application of the spillover index (Diebold and Yilmaz 2012), spillover asymmetric measures (Barunik et al. 2017), and frequency connectedness (Barunik and Křehlík 2018) methods provides deeper insights into the nature and dynamics of volatility spillover from Bitcoin markets and foreign exchange pairs denominated in six major trading currencies. These methods are the latest innovations and the most appropriate for analyzing the comprehensive nature and dynamics of spillover among conventional and alternative investment assets (Qarni and Gulzar 2018, 2019, 2020). These methods are widely used to study the dynamics of return and volatility spillovers among integrated markets.
Spillover index
Research on volatility spillover dynamics among financial markets was revolutionized by the introduction of the spillover index method under the VAR framework by Diebold and Yilmaz (2009). Due to the application of Cholesky factorization by the original Diebold and Yilmaz (2009) spillover index model, the results were dependent on the ordering of the variables. For Diebold and Yilmaz’s (2009) model, it was necessary to place the most significant variable first. However, this knowledge in advance is unknown, and thus, to make the results independent of the ordering of the variables, Diebold and Yilmaz (2012) improved the model. Diebold and Yilmaz’s (2009) model is limited in ability, because it calculates only the total directional volatility spillover to or from each market from or to all other markets, and cannot estimate the directional volatility spillover to or from each market from or to other individual markets. The estimates of individual directional volatility spillover are important to identify the net receiver and net transmitter of volatility so that source of volatility spillover can be identified. In Diebold and Yilmaz’s (2012) generalized VAR method, the estimation of volatility spillover is based on the VAR model developed by Engle et al. (1988). However, under Diebold and Yilmaz’s (2012) method, aggregate spillover effects among markets are estimated using variance decomposition. To calculate the volatility spillover for each market i, we sum the shares of its forecast error variance that is due to shocks to market j, for all \(j \ne i\), and then we sum across all \(i = 1, \ldots N\). By application of the generalized VAR model of Koop et al. (1996) and Pesaran and Shin (1998) and Diebold and Yilmaz (2012) made the results of the spillover index independent of the ordering of the variables. Diebold and Yilmaz’s (2012) model also allows for the estimation of net directional volatility spillover, thereby overcoming the limitation of the previous model by Diebold and Yilmaz (2009). In this study, Diebold and Yilmaz’s (2012) spillover index method, which eliminates the dependence of the results on the ordering of variables, is applied to analyze the average and directional volatility spillover behavior from Bitcoin markets and foreign exchange pairs denominated in six major trading currencies. The method is explained as follows.
Consider N-variable VAR (p), which is covariance stationary,
where \(x_{t} = x_{1,t} ,x_{2,t}\) and \(\Psi\) is a \(2 \times 2\) parameter matrix. In the present study \(x\) is a vector of volatilities for each of the selected markets. A vector of error terms that is independent and identically distributed is represented by \(\varepsilon_{t}\).
Equation (2) estimates the moving average, where \(N \times N\) coefficient matrixes following the recursion \(C_{i} = \theta_{1} C_{i - 1} + \theta_{2} C_{i - 2} + \cdots + \theta_{p} C_{i - p}\) are represented by \(C_{i}\). The identity matrix with \(C_{i} = 0\) for \(i < 0\) is represented by \(C_{0}\). H-step ahead forecast error variance in \(x_{i}\) is due to shock to \(x_{i}\), for \(i = 1,2, \ldots N\) is calculated as own spillover and H-step ahead forecast error variance in \(x_{i}\) is due to shock to \(x_{j}\), \(i,j = 1,2,....N\), such that \(j \ne i\) is calculated as cross-market spillover.
Orthogonality achieved by employing Cholesky factorization makes the resulting variance decomposition dependent on the ordering of the variables. This issue is solved under Diebold and Yilmaz’s (2012) method by applying the generalized VAR method of Koop et al. (1996) and Pesaran and Shin (1998). This H-step ahead forecast error variance (Koop et al. 1996; Pesaran and Shin 1998) is computed as
where the matrix of \(\varepsilon\) is denoted by \(\Theta\), the standard deviation of error term for equation i is denoted by \(\sigma_{ii}^{{}}\), and the selection vector with one as the ith element or zero otherwise is denoted by \(e_{i}\). Because the shock to each variable is not orthogonalized, the row sum of variance decomposition does not equal 1.
The diagonal elements in the matrix of volatility spillover index represent the own market’s volatility spillover contribution. Off-diagonal row elements of the volatility spillover index matrix represent the volatility spillover contribution from others to a market, whereas the off-diagonal column elements of the volatility spillover index matrix represent the volatility spillover contribution to others from a particular market. Each entry of the variance decomposition matrix is normalized by the sum of the row and column to compute the spillover index as follows:
as per construction, \(\sum\nolimits_{j = 1}^{N} {\tilde{\gamma }_{ij}^{g} (H)} = 1\) and \(\sum\nolimits_{i.j = 1}^{N} {\tilde{\gamma }_{ij}^{g} (H)} = N\).
The total volatility spillover is computed as
Spillover asymmetry measure
Spillover asymmetry measures (SAM) among Bitcoin markets and foreign exchange pairs for six major trading currencies are examined by applying Barunik et al.’s (2017) SAM method. In contrast to the spillover index method (Diebold and Yilmaz 2012), to measure spillover asymmetry (Barunik et al. 2017) a 2N-variable VAR (p) is applied by decomposing each volatility series into positive and negative volatilities. The SAM is calculated by taking the difference of positive and negative spillover. The TO and FROM spillover is calculated by taking the sum of the corresponding row and column of the \(2N \times 2N\) spillover matrix computed by the standard Diebold and Yilmaz (2012) model and subtracting the main diagonal of the \(2N \times 2N\) spillover matrix and the two sub-diagonals in the \(N \times N\) sub-matrixes on the lower left and the upper right of the \(2N \times 2N\) main matrix. The notion of SAM was introduced by Barunik et al. (2015) and extended by Barunik et al. (2017) by including positive and negative volatilities in a single VAR model of 2N variables.
The SAM with H-step ahead forecast at time \(t\), \(SAM_{2N}^{H}\), is defined as the difference among volatility spillovers due to positive and negative spillover. The directional TO SAM is calculated as
where \(S_{i,}^{g} (H)\) and \(S_{i + N,}^{g} (H)\) are volatility spillover due to positive and negative volatilities, respectively. If SAM is positive, it indicates larger positive volatility spillover than negative volatility spillover. In case SAM is negative, it indicates larger negative volatility spillover than positive volatility spillover.
Similarly, the directional FROM SAM can be computed as follows:
Frequency connectedness
To analyze the frequency connectedness within Bitcoin and foreign exchange pairs for six major trading currencies, we employed Barunik and Křehlík’s (2018) method. The model employs spectral representations of variance decomposition method of Dew-Becker and Giglio (2016) to estimate unconditional connectedness in time frequency. Frequency connectedness relations in time frequency domain were first introduced by Barunik and Krehlik (2016) and extended by Barunik and Křehlík (2018). The frequency connectedness method of Barunik and Křehlík (2018) analyzes the spectral representation of variance decomposition estimated from frequency responses to shocks, replacing the impulse responses to shocks. The frequency response function is estimated as a Fourier transform.
We allow the spectral behavior of series \(X_{t}\) to decompose the generalized impulse response function as follows:
In Eq. (9), \(S_{x} \left( w \right)\) denotes the power spectrum that defines the distribution of \(X_{t}\) variance over the frequency domain \(w\). In Eq. (9), frequency is denoted by \(w\) and infinite horizon connectedness is denoted by \(\infty\), and calculated as \(\Psi (e^{ - ihw} ) = \sum\nolimits_{h = 0}^{\infty } {\Psi_{h} e^{ - ihw} }\) (Barunik and Krehlik 2016). On a specific frequency \(w\), the unconditional generalized forecast error variance decomposition is computed as
Equation (10) can be standardized as
Barunik and Křehlík (2018) suggested an accumulative connectedness measure over a random frequency band \(d = \left( {a;,b} \right)\), expressed as
The total connectedness inside a frequency band \(d\) can be expressed as
A measure of \(C^{d}\) near to unity specifies high connections inside the spectral band \(d = \left( {a;,b} \right)\). The within from connectedness calculates the influence of one market \(\left( {i \ne j} \right)\) on another market \(i\) within a specific spectral band \(d\), which can be expressed as
The within to connectedness calculates the contribution to one market \(\left( {i \ne j} \right)\) by another market \(i\) within a specific spectral band \(d\), which can be calculated as
The overall connectedness \(C\) can be calculated as \(S^{g} \left( H \right) = \sum\nolimits_{d} {\tilde{C}^{d} }\) (Diebold and Yilmaz, 2012).
Data and descriptive
This study investigates the dynamics of volatility spillover between Bitcoin markets and foreign exchange pairs denominated in six major trading currencies data for each Bitcoin index; the foreign exchange pairs consist of 1567 observations dated from September 17, 2014 to December 31, 2018. The volatility is calculated using the normalized high, low, and closing price for the markets (Rogers and Satchell, 1991) as
where \(P_{h,t}\) is the high price, \(P_{l,t}\) the low price, and \(P_{c,t}\) the closing price on day \(t\). The Rogers and Satchell (1991) volatility estimator is used, because it is more efficient than classical volatility estimators and is drift independent, as confirmed by Shu and Zhang (2006).
The descriptive statistics (Table 1) shows the presence of negative mean volatility for all series except EUR:BTC, CAD:BTC, EUR:USD, BPS:USD, BPS:EUR, AUD:EUR, CAD:EUR, and CAD:EUR. The standard deviation statistics indicate that the volatilities for the Bitcoin markets are higher than the foreign exchange volatilities. The Bitcoin prices increased significantly during the Cyprus crisis (2013), as investors favored Bitcoin and the Bitcoin market in Europe exhibited extreme volatility and positive skewness over the long run (Bouri et al. 2017a, b). The statistics for the skewness, kurtosis, and the Jarque–Bera test indicate that none of the series is normally distributed. The augmented Dickey–Fuller statistics are significant and show that all series are stationary at level.
Results and discussion
Volatility spillover index
The volatility spillover index in Table 2 presents the average volatility spillover among the Bitcoin markets and foreign exchange pairs denominated in major trading currencies. The average volatility spillover among Bitcoin markets and the foreign exchange pairs denominated in major trading currencies is 58.3% during the sampled period. The highest own market volatility spillover contribution is shown by EUR:BTC (98.41%), with only 1.59% contributions from others to its volatility and 1.07% contributions to others’ volatility from EUR:BTC. Hence, the EUR:BTC market is the most isolated market in the sample and thus, is least vulnerable to volatility spillover from other markets in the sample. The isolated nature of EUR:BTC signifies its portfolio diversification capabilities for the foreign exchange portfolios of major trading currencies and hence, its usage as a risk minimization instrument.
The CAD:JPY is the highest recipient of volatility spillover from others (76.27%), followed by AUD:JPY (74.87%), BPS:JPY (73.12%), and CAD:EUR (72.47%). The highest volatility spillover to CAD:JPY comes from AUD:JPY (13.03%) and the lowest volatility spillover to CAD:JPY comes from CAD:BTC (0.009%). The volatility spillover from the Bitcoin markets to CAD:JPY range from 0.009 to 0.154%, indicating minimal influence of Bitcoin markets on the volatility of the CAD:JPY pair. The evidence for minimum influence of Bitcoin markets on CAD:JPY highlights the fact that a crisis event in the Bitcoin markets has a minimal impact on the CAD:JPY exchange rate. The presence of minimal influence from Bitcoin markets to CAD:JPY indicates its portfolio diversification abilities for CAD:JPY.
The CAD:JPY pair is the highest transmitter of volatility spillover to others (96.45%), followed by BPS:JPY (88.45%) and CAD:EUR (84.72%). The highest volatility spillover from CAD:JPY occurs to JPY:USD (15.28%), followed by AUD:JPY (13.89%) and CAD:USD (13.09%). The volatility spillover from CAD:JPY to the Bitcoin markets range from 0.022 to 0.25%, indicating less integration of foreign exchange markets with Bitcoin markets. The highest volatility spillover from CAD:JPY among the Bitcoin markets occurs to JPY:BTC (0.25) and the lowest volatility spillover among the Bitcoin markets occurs to CAD:BTC (0.022); this provides evidence of portfolio diversification for alternative currency Bitcoin trading. The findings indicate significant intra-Bitcoin market volatility spillover, with little influence from and to the foreign exchange pairs of major trading currencies.
The CAD:JPY volatility is most influenced by others (76.23%) and EUR:BTC volatility is least influenced by others (1.59%). CAD:JPY volatility also influences the volatility in others the most (94.45%) while EUR:BTC volatility least influences the volatility in others (1.07%). On average, there is a volatility spillover of 58.3% across the Bitcoin markets and the foreign exchange pairs denominated in major trading currencies, with most of the spillover due to intra-Bitcoin markets’ and intra-foreign exchange pairs’ volatility spillover. The presence of high intra-market volatility spillover in the Bitcoin and foreign exchange markets necessitates cross-market diversification among Bitcoin and foreign exchange pairs of major trading currencies to achieve an optimal diversified portfolio. The varying nature of portfolio diversification due to alternative currency Bitcoin trading was also identified by Vaddepalli and Antoney (2018), who revealed the varying nature of efficiency among the US dollar and euro Bitcoin markets. Similarly, in line with our findings, Urquhart and Zhang (2019) provided evidence of dissimilar portfolio diversification capabilities possessed by alternative currency Bitcoin trading.
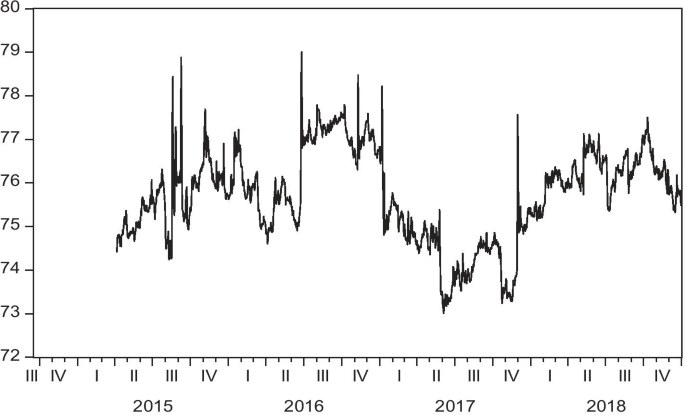
The time-varying patterns of volatility are analyzed by rolling window analysis with a 200-day window and 10-step forecast horizons. Using a small rolling window length increases variance and results in large mean square forecast errors (Pesaran and Timmermann 2002). The selection of window lengths should be such that it balances the increase in variance and loss of data in the initial window (Molodtsova and Papell 2009; Clark and West 2007). The 200-day rolling window is selected to capture enough information so that we do not capture irrelevant information or lose important information. The robustness of the applied models is checked by changing the rolling window length and the results are found to be robust, with low sensitivity to rolling window length. The rolling window analysis captures the cyclical patterns in volatility spillover that are not captured by the static spillover index. The time-varying volatility spillover (Fig. 1) depicts varying patterns in response to global financial and economic events, with decline in spillover during the second quarter of 2015 to the third quarter of 2015 due to stabilization of the Eurozone. The volatility spillover showed a rising trend thereafter until the fourth quarter of 2015 due to the Chinese stock market crash on June 12, 2015.

Average volatility spillover—Bitcoin markets and foreign exchange pairs denominated in major trading currencies. The Y-axis depicts the volatility spillover values and the X-axis depicts the time period
In the first quarter of 2016, the volatility spillover among the Bitcoin markets and foreign exchange pairs denominated in major trading currencies declined as Chinese stock market turbulence came to an end in February 2016. In June 2016, the volatility spillover showed a sharp increase due to the Brexit announcement on June 23, 2016, with a gradual decrease afterward. In the fourth quarter of 2016, volatility spillover again increased due to uncertainty in global financial markets caused by a Chinese reform initiative in August 2016. By the start of the first quarter of 2017, volatility spillover had fallen sharply, with eventual spikes in response to global financial events depicting more stable behavior. Another significant decline in volatility spillover occurred during the fourth quarter of 2017, indicating stabilization of the financial system after the end of various crisis events, such as the Brazilian economic crisis and OPEC’s world oil outlook for 2017.
The volatility spillover shows a steep rise from October 2017 to the second quarter of 2018. By the start of the third quarter of 2018, volatility spillover depicted a declining trend until the end of the sample period, indicating more responsive behavior to the stabilization of global economic and financial system. The variation in volatility spillover dynamics among the analyzed markets shows the responsive behavior to various financial and economic events and thus, provides implications based on the close observation of such movements.
Asymmetric connectedness among Bitcoin markets and foreign exchange pairs denominated in major trading currencies
Table 3 depicts the 2N variable volatility spillover index for positive and negative volatility spillover among the Bitcoin markets and foreign exchange pairs denominated in six major trading currencies. The findings revealed that volatility spillover (63.8%) among the Bitcoin and foreign exchange pairs for six major trading currencies has increased due to incorporation of separate influence of positive and negative spillover. This finding clearly highlights the presence of asymmetry in the spillover among the selected markets.
The 2N variable volatility spillover index (Table 3) indicates that negative volatility for the CAD:BTC pair received the highest volatility spillover (81.24) from others and positive volatility for the CAD:JPY pair transmitted the highest volatility spillover (98.94) to others. Meanwhile, positive volatility for the EUR:BTC pair received the lowest volatility spillover (5.52) from others and transmitted the lowest volatility spillover (2.3) to other Bitcoin and foreign exchange pairs for six major trading currencies. The highest own market volatility spillover is depicted by positive volatility in EUR:BTC (94.16). The lowest own market persistence in volatility spillover is depicted by negative volatility in AUD:BTC (18.19).
The time-varying pattern depicted by average volatility spillover for the 2N variable model with positive and negative volatilities (Fig. 2) resembles the N variable volatility model; however, the average volatility spillover depicted by the 2N variable model of positive and negative volatilities depicts more responsive behavior to global financial and economic events with frequent spikes. The time-varying nature of SAM from each Bitcoin market and foreign exchange pair for six major trading currencies is depicted in Fig. 3. The graphical analysis clearly reveals the presence of asymmetric volatility spillover among the Bitcoin markets and foreign exchange pairs of six major trading currencies.
Average volatility spillover for the 2N-dimensional VAR model with positive and negative volatilities—Bitcoin markets and foreign exchange pairs of major trading currencies. The Y-axis depicts the volatility spillover values and the X-axis depicts the time period

Directional FROM SAM—Bitcoin markets and foreign exchange pairs of major trading currencies \(SAM_{2N,i \leftarrow \bullet }^{H}\) The Y-axis depicts the volatility spillover values and the X-axis depicts the time period
In depth analysis of the “FROM SAM” volatility spillover (Fig. 3) reveals that JPY:EUR, BPS:BTC, CAD:USD, CAD:JPY, AUD:USD, CAD:EUR, AUD:EUR, AUD:BPS, BPS:JPY, BPS:USD, AUD:BTC, CAD:BTC, EUR:USD, CAD:AUD, and BPS:EUR received net positive return spillover and BTC:USD, EUR:BTC, CAD:BTC, JPY:USD, JPY:BTC, and AUD:JPY received net negative return spillover from others during the sampled period. The highest net negative spillover from others was received by USD:BTC and the lowest net negative spillover from others was received by AUD:JPY. The highest net positive spillover was received by BPS:EUR and the lowest net positive spillover was received by JPY:EUR.
The findings of “TO SAM” volatility spillover (Fig. 4) reveal that AUD:USD, BPS:EUR, BPS:JPY, CAD:AUD, JPY:EUR, EUR:USD, CAD:BTC, AUD:BTC, and BPS:BTC transmitted net positive volatility spillover to others and USD:BTC, CAD:BPS, AUD:EUR, AUD:JPY, BPS:USD, CAD:USD, EUR:BTC, JPY:BTC, JPY:USD, AUD:BPS, CAD:JPY, and CAD:EUR transmitted net negative volatility spillover to others during the sampled period. The highest net positive spillover to others was transmitted by BPS:BTC and the lowest net positive spillover to others was transmitted by AUD:USD. The highest net negative spillover to others was transmitted by USD:BTC and the lowest net negative spillover was transmitted by CAD:EUR. Analyzing the separate influence of positive and negative volatilities on the volatility spillover dynamics of the investigated markets provides significant information for portfolio managers. Selection of assets that depict high positive volatility spillover to and from others could improve the risk-adjusted returns for a diversified portfolio. Similarly, exclusion of assets that depict high negative volatility spillover to and from others could improve the returns and minimize portfolio risk.

Directional TO SAM—Bitcoin market and foreign exchange pairs of major trading currencies \(SAM_{2N,i \to \bullet }^{H}\) The Y-axis depicts the volatility spillover values and the X-axis depicts the time period
Frequency connectedness
The frequency connectedness for volatility of Bitcoin markets and foreign exchange pairs for six major trading currencies is depicted in Table 4 and Fig. 5.

Time varying frequency connectedness of the Bitcoin markets and foreign exchange pairs of major trading currencies. Band 3.14 to 0.79 corresponds 1 to 4 days (Short Horizon) and band 0.79 to 0.00 corresponds 4 plus days to infinity (Long Horizon). The Y-axis depicts the volatility spillover values and the X-axis depicts the time period
The static volatility frequency connectedness results (Table 4) indicate that volatility spillover for Bitcoin markets and foreign exchange pairs for six major trading currencies is dominant at short frequencies. For volatility spillover frequency connectedness (Table 4), at short frequency, the highest “FROM” absolute (2.08) and within (3.51) connectedness with others is shown by AUD:BTC and the lowest “FROM” absolute (0.07) and within (0.12) connectedness with others is depicted by EUR:BTC. Meanwhile, as short frequency, the findings for “TO” absolute and within connectedness indicate that the highest “TO” absolute (2.61) and within (4.4) connectedness with others is shown by AUD:BTC and the lowest absolute (0.02) and within (0.03) connectedness to others is shown by EUR:BTC.
At the long horizon, the highest “FROM” absolute (1.69) and within (4.16) connectedness with others is shown by BPS:JPY and the lowest absolute (0.06) and within (0.15) connectedness from others is shown by EUR:BTC. Meanwhile, at the long horizon, the highest “TO” absolute (2.07) and within (5.1) connectedness with others is shown by CAD:JPY and the lowest absolute (0.04) and within (0.09) connectedness to others is shown by EUR:BTC.
The time-varying dynamic frequency connectedness analysis for volatility spillover at short and long frequencies reveals that volatility spillover among the Bitcoin markets and foreign exchange pairs for six major trading currencies is dominant at short frequencies and the major spillover among them occurs within 4 days of an event. Among the Bitcoin investment markets in alternative trading currencies, EUR:BTC is identified to provide the most significant diversification benefits in crisis events at both short and long horizons, and thus, provides a better means of risk minimization than Bitcoin investment in other alternative trading currencies. Moreover, the average absolute connectedness among the Bitcoin markets and foreign exchange pairs denominated in major trading currencies is higher at the short frequency (34.19%) than at long frequency (24.35%). This clearly indicates that volatility spillover is more dominant over short frequencies among Bitcoin markets and foreign exchange pairs denominated in major trading currencies.
The rolling window frequency connected at short and long frequencies is depicted in Fig. 5. The graph reveals that short frequency spillover plays a dominant role in the overall spillover during the entire sample period. Occasionally, the dominant role of short frequency spillover is taken by long frequency spillover; this is most evident during September 2015 due to the increased severity of the Eurozone crisis. Long frequency dominance is also revealed during June and July 2016 at time when Chinese stock markets collapsed and there was uncertainty in global financial markets due to the Brexit announcement and Chinese reform initiatives.
Overall, the picture of frequency connectedness reveals that investors in the Bitcoin markets and foreign exchange markets denominated in major trading currencies process information quickly and the spillover is more evident within the short horizon. The short frequency in our analysis depicts a 4-day time period, indicating that the major portion of volatility spillover among the Bitcoin markets and foreign exchange pairs of major trading currencies occurs within 4 days of an event due to fast-tracked information transmission from advances in information technology. The dominant role of short horizon volatility spillover among the analyzed markets indicates the presence of efficiency in these markets. The finding supports evidence of efficiency found by Urquhart (2016), who claimed that Bitcoin markets would eventually move toward efficiency as markets matured. Presence of efficiency in a market eliminates speculative trading and thus, prevent the formation of price bubbles. As per the findings of Fassas et al. (2020), new information should be reflected simultaneously in futures and spot prices of financial assets. The finding of short horizon volatility spillover among Bitcoin markets and foreign exchange pairs denominated in major trading currencies is in line with the findings of Fassas et al. (2020), indicating that new information is quickly incorporated among the asset prices of the analyzed markets.
The findings regarding the varying nature of portfolio diversification benefits for alternative currency Bitcoin trading are in line with the findings of previous published research. Vaddepalli and Antoney (2018) provided evidence for varying nature of efficiency for the Bitcoin markets denominated in alternative currencies. Similarly, Urquhart and Zhang (2019) provided evidence for the varying nature of portfolio diversification benefit of the Bitcoin market for different foreign exchange markets. This study contributes to evidence from past research supporting the inclusion of alternative currency Bitcoin trading as an effective portfolio diversification tool in international foreign exchange markets.
Conclusion
The aim of the present study was to investigate the dynamics of volatility spillover from Bitcoin to the foreign exchange pairs of major trading currencies. The findings of Diebold and Yilmaz’s (2012) spillover index method, Barunik et al.’s (2017) SAM, and Barunik and Křehlík’s (2018) frequency connectedness method showed evidence of low integration, asymmetric volatility spillover and a dominant role of short frequency connectedness among the Bitcoin markets and foreign exchange pairs denominated in major trading currencies, with time-varying patterns in response to various domestic and global events. Bitcoin’s unprecedented rise and investors’ increased confidence catalyze the accelerated growth of cryptocurrencies. History suggests that the more rapid the appreciation, the more rapid the depreciation. Bitcoin, even after losing more than half of its value (from $19,800 to around $8000 per coin), is still experiencing a downward trajectory over time. Despite these worrying forecasts, a Bitcoin collapse is unlikely to have any significant impact on financial markets.Footnote 5
The evidence for low integration of Bitcoin markets with the foreign exchange market has significant implications for portfolio diversification and risk minimization. Investors in the foreign exchange market can use Bitcoins investment as a hedge against the risk associated with the foreign exchange market. Similarly, Bitcoin investors can add foreign exchange investment to their portfolios to diversify their risk associated with Bitcoin investments. Portfolio managers and speculative investors can utilize the information to create their minimum risk portfolio by diversifying their investment among foreign exchange and Bitcoin markets. The Bitcoin market is newly established; therefore, historical data for Bitcoin are limited to data from July 2010, creating a lower bound on the analysis period. The limitation on historical data prevented us from analyzing the spillover behavior between Bitcoin and foreign exchange markets denominated in major trading currencies during periods of turmoil in conventional and alternative asset markets. As a future line of work, academics and researchers are encouraged to explore the application of a tail-dependence approach within the Diebold–Yilmaz framework (Bouri et al. 2020; Saeed et al. 2020) to analyze the connectedness among Bitcoin, conventional assets, and alternative investment assets.
Availability of data and materials
The datasets analysed during the current study are available online at, https://www.investing.com/
Notes
Kritoufek (2015) proposed that the unexplained nature of the Bitcoin price by economic theory makes it a pure speculative investment asset, where the main driver for price formation is investors’ speculation. Ciaian et al. (2016) found that investor attractiveness was the main driver of Bitcoin prices. There is no evidence that macro-financial developments have any impact on Bitcoin prices in the long run.
Cheah and Fry (2015) also considered Bitcoin to be a speculative investment asset due to the presence of speculative bubbles in Bitcoin prices and warned of the contagious nature of such speculative price bubbles.
Among many reasons accounted for Bitcoin bubbles to be potentially non-destructive, the most imperative suggests that to affect other financial markets, cryptocurrencies need to be embraced far more widely to gain a much greater share of leveraged investors’ assets.
Abbreviations
- AUD:BTC:
-
Australian dollars per Bitcoin
- AUD:EUR:
-
Australian dollars per euro
- AUD:BPS:
-
Australian dollars per British pound sterling
- AUD:JPY:
-
Australian dollars per Japanese yen
- AUD:USD:
-
Australian dollars per US dollar
- CAD:AUD:
-
Canadian dollars per Australian dollar
- CAD:BTC:
-
Canadian dollars per Bitcoin
- CAD:EUR:
-
Canadian dollars per euro
- CAD:BPS:
-
Canadian dollars per British pound sterling
- CAD:JPY:
-
Canadian dollars per Japanese yen
- CAD:USD:
-
Canadian dollars per US dollar
- EUR:BTC:
-
Euro per Bitcoin
- EUR:USD:
-
Euro per US dollar
- BPS:BTC:
-
British pound sterling per Bitcoin
- BPS:EUR:
-
British pound sterling per euro
- BPS:JPY:
-
British pound sterling per Japanese yen
- BPS:USD:
-
British pound sterling per US dollar
- JPY:BTC:
-
Japanese yen per Bitcoin
- JPY:EUR:
-
Japanese yen per euro
- JPY:USD:
-
Japanese yen per US dollar
- USD:BTC:
-
US dollars per Bitcoin
References
Almudhaf F (2018) Pricing efficiency of Bitcoin trusts. Appl Econ Lett 25(7):504–508. https://doi.org/10.1080/13504851.2017.1340564
Al-Yahyaee KH, Mensi W, Yoon SM (2018) Efficiency, multifractality, and the long-memory property of the Bitcoin market: a comparative analysis with stock, currency, and gold markets. Finance Res Lett 27:228–234. https://doi.org/10.1016/j.frl.2018.03.017
Antonakakis N, Chatziantoniou I, Gabauer D (2019) Cryptocurrency market contagion: market uncertainty, market complexity, and dynamic portfolios. J Int Financ Mark Inst Money 61:37–51. https://doi.org/10.1016/j.intfin.2019.02.003
Barber S, Boyen X, Shi E, Uzun E (2012) Bitter to better—how to make bitcoin a better currency. In: International conference on financial cryptography and data security. Springer, Berlin, pp 399–414. https://doi.org/10.1007/978-3-642-32946-3_29
Bariviera AF (2017) The inefficiency of Bitcoin revisited: a dynamic approach. Econ Lett 161:1–4. https://doi.org/10.1016/j.econlet.2017.09.013
Barunik J, Krehlik T (2016) Measuring the frequency dynamics of financial and macroeconomic connectedness (No. 54). FinMaP-working paper. http://hdl.handle.net/10419/125824. Accessed 2 Jan 2020
Barunik J, Křehlík T (2018) Measuring the frequency dynamics of financial connectedness and systemic risk. J Financ Econom 16(2):271–296. https://doi.org/10.1093/jjfinec/nby001
Barunik J, Kocenda E, Vacha L (2015) Volatility spillovers across petroleum markets. Energy J 36(3):309–329. https://doi.org/10.5547/01956574.36.3.jbar
Barunik J, Kočenda E, Vácha L (2017) Asymmetric volatility connectedness on the Forex market. J Int Money Finance 77:39–56. https://doi.org/10.1016/j.jimonfin.2017.06.003
Basu MR (2002) Financial contagion and investor “learning”: an empirical investigation (No. 2-218). International Monetary Fund
Baur DG, Hong K, Lee AD (2018) Bitcoin: medium of exchange or speculative assets? J Int Financ Mark Inst Money 54:177–189. https://doi.org/10.1016/j.intfin.2017.12.004
Beneki C, Koulis A, Kyriazis NA, Papadamou S (2019) Investigating volatility transmission and hedging properties between Bitcoin and Ethereum. Res Int Bus Finance 48:219–227. https://doi.org/10.1016/j.ribaf.2019.01.001
Bollerslev T (1990) Modelling the coherence in short-run nominal exchange rates: a multivariate generalized ARCH model. Rev Econ Stat. https://doi.org/10.2307/2109358
Bordo MD, Murshid AP (2001) Are financial crises becoming more contagious?: What is the historical evidence on contagion?. In: International financial contagion. Springer, US, pp 367–403. https://doi.org/10.1007/978-1-4757-3314-3_14
Bouoiyour J, Selmi R (2015) What does Bitcoin look like? Ann Econ Finance 16(2):449–492
Bouri E, Gupta R, Tiwari AK, Roubaud D (2017a) Does Bitcoin hedge global uncertainty? Evidence from wavelet-based quantile-in-quantile regressions. Finance Res Lett 23:87–95. https://doi.org/10.1016/j.frl.2017.02.009
Bouri E, Molnár P, Azzi G, Roubaud D, Hagfors LI (2017b) On the hedge and safe haven properties of Bitcoin: is it really more than a diversifier? Finance Res Lett 20:192–198. https://doi.org/10.1016/j.frl.2016.09.025
Bouri E, Das M, Gupta R, Roubaud D (2018) Spillovers between Bitcoin and other assets during bear and bull markets. Appl Econ 50(55):5935–5949. https://doi.org/10.1080/00036846.2018.1488075
Bouri E, Lucey B, Saeed T, Vo XV (2020) Extreme spillovers across Asian-Pacific currencies: a quantile-based analysis. Int Rev Financ Anal 72:101605. https://doi.org/10.1016/j.irfa.2020.101605
Brandvold M, Molnár P, Vagstad K, Valstad OCA (2015) Price discovery on Bitcoin exchanges. J Int Financ Mark Inst Money 36:18–35. https://doi.org/10.1016/j.intfin.2015.02.010
Briere M, Oosterlinck K, Szafarz A (2015) Virtual currency, tangible return: Portfolio diversification with bitcoin. J Asset Manag 16(6):365–373. https://doi.org/10.1057/jam.2015.5
Cheah ET, Fry J (2015) Speculative bubbles in Bitcoin markets? An empirical investigation into the fundamental value of Bitcoin. Econ Lett 130:32–36. https://doi.org/10.1016/j.econlet.2015.02.029
Cheah ET, Mishra T, Parhi M, Zhang Z (2018) Long memory interdependency and inefficiency in Bitcoin markets. Econ Lett 167:18–25. https://doi.org/10.1016/j.econlet.2018.02.010
Cheung A, Roca E, Su JJ (2015) Crypto-currency bubbles: an application of the Phillips–Shi–Yu (2013) methodology on Mt. Gox bitcoin prices. Appl Econ 47:2348–2358. https://doi.org/10.1080/00036846.2015.1005827
Chiu J, Koeppl TV (2019) Blockchain-based settlement for asset trading. Rev Financ Stud 32(5):1716–1753. https://doi.org/10.1093/rfs/hhy122
Ciaian P, Rajcaniova M, Kancs DA (2016) The economics of BitCoin price formation. Appl Econ 48(19):1799–1815. https://doi.org/10.1080/00036846.2015.1109038
Clark TE, West KD (2007) Approximately normal tests for equal predictive accuracy in nested models. J Econom 138(1):291–311. https://doi.org/10.1016/j.jeconom.2006.05.023
Corbet S, Lucey B, Yarovaya L (2018) Datestamping the Bitcoin and Ethereum bubbles. Finance Res Lett 26:81–88. https://doi.org/10.1016/j.frl.2017.12.006
Corbet S, Lucey B, Urquhart A, Yarovaya L (2019) Cryptocurrencies as a financial asset: a systematic analysis. Int Rev Financ Anal 62:182–199. https://doi.org/10.1016/j.irfa.2018.09.003
Dastgir S, Demir E, Downing G, Gozgor G, Lau CKM (2019) The causal relationship between Bitcoin attention and Bitcoin returns: evidence from the Copula-based Granger causality test. Finance Res Lett 28:160–164. https://doi.org/10.1016/j.frl.2018.04.019
Dew-Becker I, Giglio S (2016) Asset pricing in the frequency domain: theory and empirics. Rev Financ Stud 29(8):2029–2068. https://doi.org/10.1093/rfs/hhw027
Diebold FX, Yilmaz K (2009) Measuring financial asset return and volatility spillovers, with application to global equity markets. Econ J 119(534):158–171. https://doi.org/10.1111/j.1468-0297.2008.02208.x
Diebold FX, Yilmaz K (2012) Better to give than to receive: predictive directional measurement of volatility spillovers. Int J Forecast 28(1):57–66. https://doi.org/10.1016/j.ijforecast.2011.02.006
Dyhrberg AH (2016) Bitcoin, gold and the dollar—a GARCH volatility analysis. Finance Res Lett 16:85–92. https://doi.org/10.1016/j.frl.2015.10.008
Engle RF, Kroner KF (1995) Multivariate simultaneous generalized ARCH. Econom Theory 11(01):122–150
Engle RF, Sheppard K (2001) Theoretical and empirical properties of dynamic conditional correlation multivariate GARCH (No. w8554). National Bureau of Economic Research
Engle RF, Ito T, Lin WL (1988) Meteor showers or heat waves? Heteroskedastic intra-daily volatility in the foreign exchange market (No. w2609). National Bureau of Economic Research
Fang F, Ventre C, Basios M, Kong H, Kanthan L, Li L, Martinez-Regoband D, Wu F (2020) Cryptocurrency trading: a comprehensive survey. http://arxiv.org/abs/arXiv:2003.11352
Fassas AP, Papadamou S, Koulis A (2020) Price discovery in bitcoin futures. Res Int Bus Finance 52:101116. https://doi.org/10.1016/j.ribaf.2019.101116
Feng W, Wang Y, Zhang Z (2018) Informed trading in the Bitcoin market. Finance Res Lett 26:63–70. https://doi.org/10.1016/j.frl.2017.11.009
Fink C, Johann T (2014) Bitcoin markets. SSRN. https://doi.org/10.2139/ssrn.2408396
Forbes KJ, Rigobon R (2002) No contagion, only interdependence: measuring stock market comovements. J Finance 57(5):2223–2261. https://doi.org/10.1111/0022-1082.00494
Fry J, Cheah ET (2016) Negative bubbles and shocks in cryptocurrency markets. Int Rev Financ Anal 47:343–352. https://doi.org/10.1016/j.irfa.2016.02.008
Glaser F, Zimmermann K, Haferkorn M, Weber M, Siering M (2014) Bitcoin-asset or currency? Revealing users’ hidden intentions. Paper presented at the Twenty Second European Conference on Information Systems, Tel Aviv. https://ssrn.com/abstract=2425247. Accessed 2 Jan 2020
Gronwald M (2019) Is Bitcoin a Commodity? On price jumps, demand shocks, and certainty of supply. J Int Money Finance 97:86–92. https://doi.org/10.1016/j.jimonfin.2019.06.006
Guesmi K, Saadi S, Abid I, Ftiti Z (2019) Portfolio diversification with virtual currency: evidence from bitcoin. Int Rev Financ Anal 63:431–437. https://doi.org/10.1016/j.irfa.2018.03.004
Gulzar S, Mujtaba Kayani G, Xiao Feng H, Ayub U, Rafique A (2019) Financial cointegration and spillover effect of global financial crisis: a study of emerging Asian financial markets. Econ Res (Ekonomska Istraživanja) 32(1):187–218. https://doi.org/10.1080/1331677X.2018.1550001
Hakim das Neves R (2020) Bitcoin pricing: impact of attractiveness variables. Financ Innov 6:1–18. https://doi.org/10.1186/s40854-020-00176-3
Jalali MFM, Heidari H (2020) Predicting changes in Bitcoin price using grey system theory. Financ Innov 6(1):1–12. https://doi.org/10.1186/s40854-020-0174-9
Katsiampa P (2019) Volatility co-movement between Bitcoin and Ether. Finance Res Lett 30:221–227. https://doi.org/10.1016/j.frl.2018.10.005
Klein T, Thu HP, Walther T (2018) Bitcoin is not the New Gold—a comparison of volatility, correlation, and portfolio performance. Int Rev Financ Anal 59:105–116. https://doi.org/10.1016/j.irfa.2018.07.010
Koop G, Pesaran MH, Potter SM (1996) Impulse response analysis in nonlinear multivariate models. J Econom 74(1):119–147. https://doi.org/10.1016/0304-4076(95)01753-4
Koutmos D (2018) Return and volatility spillovers among cryptocurrencies. Econ Lett 173:122–127. https://doi.org/10.1016/j.econlet.2018.10.004
Kovanen A (2019) Competing with Bitcoin-some policy consideration for issuing digitalized legal tenders. Int J Financ Res 10(4):1–16
Kristjanpoller W, Bouri E (2019) Asymmetric multifractal cross-correlations between the main world currencies and the main cryptocurrencies. Phys A Stat Mech Appl 523:1057–1071. https://doi.org/10.1016/j.physa.2019.04.115
Kristoufek L (2013) BitCoin meets Google Trends and Wikipedia: quantifying the relationship between phenomena of the Internet era. Sci Rep 3:3415. https://doi.org/10.1038/srep03415
Kristoufek L (2015) What are the main drivers of the Bitcoin price? Evidence from wavelet coherence analysis. PLoS ONE 10(4):e0123923. https://doi.org/10.1371/journal.pone.0123923
Kyriazis NA (2019a) A survey on efficiency and profitable trading opportunities in cryptocurrency markets. J Risk Financ Manag 12(2):67. https://doi.org/10.3390/jrfm12020067
Kyriazis NA (2019b) A survey on empirical findings about spillovers in cryptocurrency markets. J Risk Financ Manag 12(4):170. https://doi.org/10.3390/jrfm12040170
Liu W (2019) Portfolio diversification across cryptocurrencies. Finance Res Lett 29:200–205. https://doi.org/10.1016/j.frl.2018.07.010
Makarov I, Schoar A (2020) Trading and arbitrage in cryptocurrency markets. J Financ Econ 135(2):293–319. https://doi.org/10.1016/j.jfineco.2019.07.001
Markowitz H (1952) Portfolio selection. J Finance 7(1):77–91
Meralli S (2020) Privacy-preserving analytics for the securitization market: a zero-knowledge distributed ledger technology application. Financ Innov 6(1):7. https://doi.org/10.1186/s40854-020-0172-y
Molodtsova T, Papell DH (2009) Out-of-sample exchange rate predictability with Taylor rule fundamentals. J Int Econ 77(2):167–180. https://doi.org/10.1016/j.jinteco.2008.11.001
Nadarajah S, Chu J (2017) On the inefficiency of Bitcoin. Econ Lett 150:6–9. https://doi.org/10.1016/j.econlet.2016.10.033
Nam K, Kim SW, Arize AC (2006) Mean reversion of short-horizon stock returns: asymmetry property. Rev Quant Financ Acc 26(2):137–163. https://doi.org/10.1007/s11156-006-7213-0
Narayan PK, Narayan S, Rahman RE, Setiawan I (2019) Bitcoin price growth and Indonesia’s monetary system. Emerg Mark Rev 38:364–376. https://doi.org/10.1016/j.ememar.2018.11.005
Omane-Adjepong M, Alagidede IP (2020) Dynamic linkages and economic role of leading cryptocurrencies in an emerging market. Asia-Pacific Financ Mark. https://doi.org/10.1007/s10690-020-09306-4
Pesaran HH, Shin Y (1998) Generalized impulse response analysis in linear multivariate models. Econ Lett 58(1):17–29. https://doi.org/10.1016/S0165-1765(97)00214-0
Pesaran MH, Timmermann A (2002) Market timing and return prediction under model instability. J Empir Finance 9(5):495–510. https://doi.org/10.1016/S0927-5398(02)00007-5
Phillip A, Chan J, Peiris S (2018) A new look at Cryptocurrencies. Econ Lett 163:6–9. https://doi.org/10.1016/j.econlet.2017.11.020
Phillips PC, Yu J (2011) Dating the timeline of financial bubbles during the subprime crisis. Quant Econ 2(3):455–491. https://doi.org/10.3982/QE82
Platanakis E, Urquhart A (2019) Should investors include bitcoin in their portfolios? A portfolio theory approach. Br Account Rev. https://doi.org/10.1016/j.bar.2019.100837
Platanakis E, Sutcliffe C, Urquhart A (2018) Optimal vs naïve diversification in cryptocurrencies. Econ Lett 171:93–96. https://doi.org/10.1016/j.econlet.2018.07.020
Polasik M, Piotrowska AI, Wisniewski TP, Kotkowski R, Lightfoot G (2015) Price fluctuations and the use of Bitcoin: an empirical inquiry. Int J Electron Commer 20(1):9–49. https://doi.org/10.1080/10864415.2016.1061413
Priem R (2020) Distributed ledger technology for securities clearing and settlement: benefits, risks, and regulatory implications. Financ Innov 6(1):1–25. https://doi.org/10.1186/s40854-019-0169-6
Qarni M, Gulzar S (2018) Volatility spillover effects of Shanghai stock exchange crash on the stock markets of its major trading partners. Bus Econ Rev 10(3):1–20
Qarni MO, Gulzar S (2019) Intra-EMU and non-EMU, EU stock markets’ return spillover: evidence from ESDC. Empirica. https://doi.org/10.1007/s10663-019-09437-6
Qarni MO, Gulzar S (2020) Return spillover across Bitcoin markets and foreign exchange pairs dominated in major trading currencies. Bus Econ Rev 12(3):123–160
Qarni MO, Gulzar S, Fatima ST, Khan MJ, Shafi K (2019) Inter-markets volatility spillover in U.S bitcoin and financial markets. J Bus Econ Manag 20(4):694–714. https://doi.org/10.3846/jbem.2019.8316
Richardson V (2014) Currency kings. Entrepreneur 42:40
Rogers LCG, Satchell SE (1991) Estimating variance from high, low and closing prices. Ann Appl Probab 1(4):504–512
Saeed T, Bouri E, Alsulami H (2020) Extreme return connectedness and its determinants between clean/green and dirty energy investments. Energy Econ. https://doi.org/10.1016/j.eneco.2020.105017
Selgin G (2015) Synthetic commodity money. J Financ Stab 17:92–99. https://doi.org/10.1016/j.jfs.2014.07.002
Sensoy A (2019) The inefficiency of Bitcoin revisited: a high-frequency analysis with alternative currencies. Finance Res Lett 28:68–73. https://doi.org/10.1016/j.frl.2018.04.002
Shu J, Zhang JE (2006) Testing range estimators of historical volatility. J Futures Mark 26(3):297–313. https://doi.org/10.1002/fut.20197
Stensås A, Nygaard MF, Kyaw K, Treepongkaruna S (2019) Can Bitcoin be a diversifier, hedge or safe haven tool? Cogent Econ Finance 7(1):1593072. https://doi.org/10.1080/23322039.2019.1593072
Tiwari AK, Jana RK, Das D, Roubaud D (2018) Informational efficiency of Bitcoin—an extension. Econ Lett 163:106–109. https://doi.org/10.1016/j.econlet.2017.12.006
Tu KV, Meredith MW (2015) Rethinking virtual currency regulation in the Bitcoin age. Wash L Rev 90:271
Urquhart A (2016) The inefficiency of Bitcoin. Econ Lett 148:80–82. https://doi.org/10.1016/j.econlet.2016.09.019
Urquhart A, Zhang H (2019) Is Bitcoin a hedge or safe haven for currencies? An intraday analysis. Int Rev Financ Anal 63:49–57. https://doi.org/10.1016/j.irfa.2019.02.009
Vaddepalli S, Antoney L (2018) Are economic factors driving Bitcoin transactions? An analysis of select economies. Finance Res Lett. https://doi.org/10.1016/j.frl.2018.04.002
Vidal-Tomás D, Ibáñez AM, Farinós JE (2019) Weak efficiency of the cryptocurrency market: a market portfolio approach. Appl Econ Lett 26(19):1627–1633. https://doi.org/10.1080/13504851.2019.1591583
Zhang YJ, Bouri E, Gupta R, Ma SJ (2020) Risk spillover between Bitcoin and conventional financial markets: an expectile-based approach. N Am J Econ Finance. https://doi.org/10.1016/j.najef.2020.101296
Funding
This research did not receive any specific grant from funding agencies in the public, commercial, or not-for-profit sectors.
Author information
Authors and Affiliations
Corresponding author
Additional information
Publisher's Note
Springer Nature remains neutral with regard to jurisdictional claims in published maps and institutional affiliations.
Appendices
Appendix
Robustness analysis
The robustness of the results is checked by changing the rolling window size to 250 days and the results are found to show low sensitivity to change in window size.

Average volatility spillover (250 days rolling window)—Bitcoin markets and foreign exchange pairs denominated in major trading currencies. The Y-axis depicts the volatility spillover values and the X-axis depicts the time period

Average volatility spillover (250 days rolling window) for the 2N-dimensional VAR model with positive and negative volatilities—Bitcoin markets and foreign exchange pairs of major trading currencies. The Y-axis depicts the volatility spillover values and the X-axis depicts the time period

Directional FROM SAM (250 days rolling window)—Bitcoin markets and foreign exchange pairs of major trading currencies \(SAM_{2N,i \leftarrow \bullet }^{H}\) The Y-axis depicts the volatility spillover values and the X-axis depicts the time period

Directional TO SAM (250 days rolling window)—Bitcoin market and foreign exchange pairs of major trading currencies \(SAM_{2N,i \to \bullet }^{H}\) The Y-axis depicts the volatility spillover values and the X-axis depicts the time period

Time varying frequency connectedness (250 days rolling window) of the Bitcoin markets and foreign exchange pairs of major trading currencies. Band 3.14 to 0.79 corresponds 1 to 4 days (Short Horizon) and band 0.79 to 0.00 corresponds 4 plus days to infinity (Long Horizon). The Y-axis depicts the volatility spillover values and the X-axis depicts the time period
Rights and permissions
Open Access This article is licensed under a Creative Commons Attribution 4.0 International License, which permits use, sharing, adaptation, distribution and reproduction in any medium or format, as long as you give appropriate credit to the original author(s) and the source, provide a link to the Creative Commons licence, and indicate if changes were made. The images or other third party material in this article are included in the article's Creative Commons licence, unless indicated otherwise in a credit line to the material. If material is not included in the article's Creative Commons licence and your intended use is not permitted by statutory regulation or exceeds the permitted use, you will need to obtain permission directly from the copyright holder. To view a copy of this licence, visit http://creativecommons.org/licenses/by/4.0/.
About this article

Cite this article
Qarni, M.O., Gulzar, S. Portfolio diversification benefits of alternative currency investment in Bitcoin and foreign exchange markets. Financ Innov 7, 17 (2021). https://doi.org/10.1186/s40854-021-00233-5
Received:
Accepted:
Published:
DOI: https://doi.org/10.1186/s40854-021-00233-5