- Research
- Open access
- Published:
Portfolio management under capital market frictions: a grey clustering approach
Financial Innovation volume 10, Article number: 110 (2024)
Abstract
International portfolio management is influenced by the existence of “frictions”, factors or events that interfere with trade, which are linked in financial literature to market-specific factors, such as available information, restrictions, investor protection, or market liquidity. Given the wide variety of factors that can be included in these categories, scientific studies typically focus on a reduced number of indicators at a time in order to offer an in depth analysis of their impact. We offer a consolidated view of the perspectives observed in financial literature by proposing a novel index for market frictions that includes all these four components and rank fifteen post-communist East European capital markets based on their index values. We then constructed various scenarios by assuming different levels of importance for the criteria used in index construction. By employing grey clustering analysis, we cluster these capital markets into three categories—strongly recommended, recommended with some reserve, and not recommended—based on the importance given by the decision maker to these factors. The results show that some of the studied markets are in the same cluster, irrespective of the chosen scenario. The only market always included in the “strongly recommended” category is Hungary, indicating that it is a good investment option for international participants. Bulgaria and Slovakia are always regarded as “recommended with reserve” markets, whereas the Republic of Moldova is part of the “not recommended” category. The other markets show a degree of variability that can be explained by different investor perspectives. This study contributes to the existing literature by combining the advantages of grey clustering and portfolio analysis. Investors can use this approach during the decision-making process related to their investments.
Introduction
Many studies in finance are closely intertwined with the efficient market hypothesis (EMH). Notably, these studies are divided into those that support the hypothesis, as exemplified by Fama (1991, 1998), and those that challenge it, as demonstrated by the works of Shiller (1980) and De Bondt and Thaler (1985). This dichotomy in approaches extends across both developed and emerging markets (Lim and Brooks 2011).
The aforementioned studies assess the informational efficiency of financial markets, particularly in terms of an investor's capacity to achieve systematic abnormal returns. As Fama (1991) highlights, various analytical tools and techniques have been developed to achieve this objective, including those related to return predictability, event studies, and the consideration of private information. These avenues have been explored in diverse contexts to elucidate the mechanisms by which systematic abnormal returns can be generated (Lo 2004, 2005; Lim and Brooks 2011).
However, it is important to recognize that market frictions can influence the attainment of systematic abnormal earnings. Factors such as transaction fees, taxation, trading restrictions, etc. (Dragotă and Mitrică 2004) play a pivotal role in shaping the landscape of portfolio management and, in turn, determining the effective returns achieved through chosen investment strategies. The quality of the market can be significantly affected by the magnitude of these frictions as well (Grullon et al. 2015; Aitken et al. 2017; Comerton-Forde et al. 2018).
Within this framework, this study is distinctly centered on the influence of friction, which has repercussions on market efficiency. Specifically, it examines the organizational efficiency of capital markets. To accomplish this objective, we develop an index that encapsulates the various frictions capable of influencing investors’ decision-making processes within the capital market.
Notably, an established body of financial literature yields numerous indices tailored to quantify the qualitative aspects of diverse financial landscapes (La Porta et al. 1998; Pistor et al. 2000; Djankov et al. 2008). These indices serve as invaluable tools for offering a consolidated overview of the financial phenomena under scrutiny. It is plausible that the necessity for such indices arose in response to the ongoing global proliferation of information, which can be attributed, at least in part, to technological advancements achieved in recent decades (McAfee and Brynjolfsson 2012; Chen and Zhang 2014).
The concept of information overload (Eppler and Mengis 2004) is not novel in the literature, and it poses a significant challenge to the decision-making process. The sheer volume and velocity of new data can bewilder individuals, particularly investors, in the financial realm, making the task of discerning relevant information more arduous (Jacoby 1977).
When the influx of information surpasses an investor's processing capacity, investors may resort to indiscriminately disregarding a substantial portion of it (Herbig and Kramer 1994; Sparrow 1999). Consequently, an excessive amount of information can result in a decelerated decision-making process (Jacoby 1984) or even erroneous choices (Malhotra 1982).
The primary research question addressed in this study pertains to the extent to which frictions influence investors’ trading activities. To this end, we introduce an index as a proxy for the absence of market friction (hereafter, Market Frictions Index—MFI) from the perspective of individual investors. This index comprises four key components, each of which can also be considered a standalone index: (i) accessibility of information, (ii) absence of trading restrictions, (iii) safeguards for protecting investors' wealth, and (iv) market liquidity. The proposed index serves to consolidate a multitude of perspectives drawn from the financial literature, an aspect that has not been done before, enabling a quantification of the impact of various “frictions” on the decision-making processes within the capital market, as demonstrated by Liew et al. (2022) and Merl et al. (2022). Our study bridges this gap in the literature by offering a comprehensive overview of the diverse frictions examined within the financial domain. These indices are estimated for 14 post-communist East European capital markets: Bosnia–Herzegovina, Bulgaria, Croatia, Czechia, Estonia, Hungary, Latvia, Lithuania, the Republic of Moldova, Poland, Romania, Serbia, Slovakia, and Slovenia, based on their conditions offered in 2012. This year was chosen because it represents a period when the economic environment was hostile (as seen in the low and even negative levels of the gross domestic product [GDP] growth rate); thus, it is a period when the conditions offered by the market participants and the legal framework could have been modified in such a way to attract much-needed investors. These countries have also been studied in numerous articles related to the EMH, such as by Dragotă and Ţilică (2014), but with varying results. We propose an explanation based on the different market conditions that characterize the 14 markets.
Our index can be useful to both academic researchers and portfolio management professionals. In the recent literature, portfolio management is approached considering the particularities of different classes of investors. Following the same train of thought, our study is conducted from the perspective of a class of small investors, that is, investors with relatively low budgets. Thus, the differences between small and institutional investors may be important. For example, trading fees, one of the factors considered in this study, have an important impact on the trading decisions of small investors as opposed to those of large investors, for whom these costs might be negligible.
The second research question of the study is “Which capital market could be the investor’s choice for trading, assuming various levels of significance given to the different market frictions?” In this context, the objective of our study was to provide a recommendation, using grey clustering, for splitting these post-communist East-European capital markets into three clusters, based on the components of the market frictions index: (A) recommended without reserve; (B) recommended with some reserve; (C) not recommended. Grey clustering can be successfully applied to this type of analysis, as it is flexible and provides adequate information in the context of small databases (Liu et al. 2022c; Delcea and Cotfas 2023). This methodology, applied to the components of the market friction index, also contributes to the existing literature on portfolio management decisions.
A range of scenarios has been meticulously examined to emulate real-life decision-making situations and accommodate various types of decision-makers. The findings underscore that the recommendations offered to decision-makers are contingent on the weight assigned to distinct factors, including the availability of information, market restrictions, investor protection, and market liquidity. For instance, Hungary stands out as the sole market that is consistently recommended without reservations across all considered scenarios.
Similarly, Estonia, Latvia, and Lithuania typically receive favorable recommendations without reservations in most scenarios, with the exception of cases in which the decision-maker's primary concern centers on market liquidity. Similarly, Czechia, Poland, and Romania are generally highly recommended although investor protection is emerging as a criterion that occasionally presents challenges.
Conversely, the markets in Bosnia and Herzegovina exhibit heightened sensitivity to friction, particularly the Sarajevo market, resulting in their frequent inclusion in the “not recommended” cluster across various scenarios. Similarly, the market in the Republic of Moldova consistently garners a “not recommended” status for investment in all scenarios, primarily due to the pronounced level of friction associated with it.
The remainder of this paper is organized as follows. "Literature review" section presents the theoretical background of the study. "Methodology" section describes the methodology and "Data" section describes the database. The results are presented and discussed in "Results" section. "Robustness check" section presents the results of the robustness tests. The final section concludes the paper and discusses some limitations and directions for future research.
Literature review
In this section, we present the theoretical groundwork of our study. Initially, we address fundamental concepts related to market efficiency within the context of the EMH. Subsequently, we delve into the theoretical foundations essential for developing the market friction index. Finally, we provide a comprehensive literature review of the principles of grey clustering.
Organizational market efficiency in the context of the EMH
The EMH is still a cornerstone in financial economics (Fama 1991, 1998). Theoretically, when investors act in an efficient market, they can invest their available financial resources in investment projects (including financial assets) at a price that reflects the available information (Fama 1970). Over time, numerous studies has challenged the EMH, such as De Bondt and Thaler (1985) and Shiller (1980); however, the theory also has strong proponents, such as Fama (1998).
Fama (1970) states the following as sufficient conditions for a market to be efficient: (i) the absence of transaction costs in trading securities, (ii) the costless availability of information (for all participants), and (iii) a homogeneous understanding of the current information's implications on the current price and the distribution of the future prices for each security. He also states that these conditions are sufficient but not necessary. However, even if they are not mandatory, they are potential sources of market inefficiency, and their study is “the major goal of the empirical work in this area” (Fama 1970). In this study, we focused on the first two conditions as the starting points for constructing our index.Footnote 1
Using this reasoning as a basis, we constructed an informational market efficiency index to reflect the degree to which a market is affected by friction. The lower the impact of these factors, the higher is the level of efficiency, leading to a higher index level (e.g., 100–a perfectly efficient market, 0–a completely inefficient market). This study focuses on the presence of friction in the market (higher values for MFI signify lower presence of market friction).
One of the most studied frictions is the available information (Fama 1970, 1991; Grossman and Stiglitz 1976). Asymmetrical information can cause inefficiency because one class of investors (with the same abilities as others) can earn systematic abnormal earnings. Sometimes, information is available but at a very high cost. For instance, information on stock exchanges can be provided for free (a prerequisite for market efficiency) or at a prohibitive cost. The same class of frictions can include the (lack of) liquidity in the market, presence of taxes and trading fees, ownership concentration, and restrictions regarding the access of foreign investors in the market.Footnote 2
The existence of friction has proven to have significant implications. For example, Avdiu and Gruhle (2022) show that frictions related to information access can explain the presence of financial contagion among independent markets because costly information can influence investors to group countries and trade accordingly. Moreover, emerging markets have a higher probability of developing this contagion channel because they offer lower incentives to investors to demand country-specific information than do developed markets.
The proposed friction index (MFI), constructed based on the considerations previously presented, can be used as a partial proxy for the market’s level of organizational efficiency, as presented in the next section.
Indexes for market frictions
The financial literature proposes different indices for measuring the quality of the financial environment in different contexts. The anti-self-dealing index (Djankov et al. 2008) and anti-director rights (La Porta et al. 1997) are extensively used to quantify minority shareholders' protection in an international context. Similarly, creditor rights are usually proxied using the index proposed by La Porta et al. (1998). Indices can provide a synthetic perspective on the analyzed issue.
The list of market conditions that impede investors from reacting to newly available market information is extensive, as shown by Karolyi (2015). We follow a decision-making philosophy from the investor perspective. Their objectives can sometimes differ considerably from those of the other main players in capital markets, such as issuers of financial assets, the government, brokers, and stock exchanges.
Typically, individuals opt to become investors in markets that offer convenient access to the financial assets they find appealing, while also providing a safeguard for their investments. The pivotal role they play cannot be understood, as they are instrumental in maintaining market liquidity by functioning as both buyers (from either the primary issuer or the secondary market) and sellers in the secondary market. To effectively carry out this role, investors must have access to a wealth of pertinent information encompassing details about the legal framework, trading regulations, available assets, and so on (Yildiz 2021).
Issuers are driven to secure funds from the market at minimal cost to facilitate their operations. To achieve this, they must attract investors by promoting the assets they offer. However, a well-crafted advertising strategy alone may not suffice for informed investors. These astute investors prioritize issuer quality; hence, they meticulously scrutinize financial statements and other relevant issuer-related information to gauge growth prospects. These assessments significantly influence their decisions to include specific assets in their portfolios. Consequently, financial assets issued by high-quality entities tend to experience heightened market demand from informed investors (Yildiz 2021; Khlifi 2021).
Stock exchanges and brokers share the common goal of cultivating a liquid market characterized by a high volume of substantial transactions. This liquidity is conducive to revenue generation through trading fees and various registration and management charges. Furthermore, a robust level of market liquidity has the potential to pique the interests of a broader spectrum of investors, whether local or foreign, thereby enhancing trading activities. To facilitate this, stock exchanges and brokers are motivated to provide comprehensive and pertinent information and occasionally extend their analytical support. Such efforts aim to attract potential buyers and sellers, and create an environment that fosters robust market participation (Lesmond 2005).
The government is keen on gaining substantial tax revenue to support its proposed initiatives and objectives. One of the most effective approaches to achieve this goal is to establish a symbiotic fiscal and legal framework that fosters a conducive economic environment in general, and the trading process in particular. This can be realized by establishing an attractive tax regime, formulating a legal framework that safeguards investors' wealth and earnings, and eliminating legal constraints that may prevent certain investors from entering the market. By cultivating an attractive and competitive environment, the government can increase its tax revenue by drawing from capital gains taxes paid by investors and income taxes levied on issuers and other financial entities. The greater the number of prosperous participants in the market, the higher is the volume of taxes collected. Consequently, investors’ experiences are intrinsically tied to the economic and fiscal landscape shaped by the government, necessitating access to timely information on any legal modifications pertaining to these determinations (Dasilas and Grose 2019).
The information made available by financial asset issuers, the government, brokers, and stock exchanges is of paramount significance in investors’ decision-making processes when choosing the most suitable stock exchange. For instance, Yildiz (2021) shows that higher information asymmetry leads to significantly different portfolios created by foreign and domestic investors, with the former choosing firms with higher market performance. Thus, the first component of our index (I1) quantifies market quality from this perspective (Table 1).
Market restrictions also influence investors. For instance, the absence of specific markets and constraints on foreign investors can prevent certain individuals from implementing their preferred trading strategies. Merl et al. (2022) investigated the impact of market interventions or restrictions on investor behavior. They found that informed traders increase their market activity in the absence of restrictions, thus reducing mispricing and market spreads. Thus, the second component (I2) investigates the existence of such restrictions.
Investors are also affected by several factors, including the fiscal burden, which encompasses the level of taxation and fees imposed on the capital market. In addition, corporate governance regulations, the efficacy of legal enforcement, and the extent of protection offered to minority shareholders and/or creditors play pivotal roles. For example, the effectiveness of legal enforcement and fiscal burden serve as signals to investors regarding the safety and degree of consideration extended by the state within the market's legal framework. Indeed, the market value of a company decreases due to agency problems between controlling and minority shareholders (Lefort and Walker 2007). Thus, a higher level of shareholder protection is required. Hence, the third component (I3) considers aspects related to investor protection.
Even when market conditions are favorable, as determined by the results of the preceding three components, an investor may remain hesitant to engage in trading in this market. This hesitation may stem from the unavailability of the opportunity to capitalize on these favorable conditions because of the inadequate liquidity of the desired assets. Thus, the fourth MFI component (I4) accounts for liquidity issues in the market.
Based on these considerations, the frictions that influence the market can be clustered into four main categories (as listed in Table 1). These factors can be considered the four main components of the proposed index. Some factors can be considered as criteria for more than one component of our index. For instance, Klapper and Love (2004) showed that market valuation is highly correlated with firm-level corporate governance, which, in turn, becomes more effective in environments with high levels of access to asymmetric information and weak legal systems.
These four categories of factors encompass the criteria investors employ in their decision-making processes. Although the inclusion of specific criteria within a particular component may be a subject of debate, informed investors should consider them to varying degrees when making investment decisions. To actively participate in a market, an investor must find a set of conditions that are concurrently met; there should be an ample amount of publicly available information to form an accurate perception of the market; the country's legal framework should provide adequate safeguards for the investor's wealth; the market should exhibit sufficient liquidity to support the type of trading strategy the investor is seeking; and the conditions, whether legal or otherwise, should not be so restrictive as to deter the investor from entering the market and trading the preferred type of financial asset. However, the level considered “satisfactory” can vary depending on the individual conducting the assessment.
Literature review on grey clustering
Grey systems theory has been used on a large scale in both theoretical and practical applications and it works in an environment with a high level of uncertainty (Liu and Lin 2011; Liu et al. 2017). Among the elements of novelty brought about by the grey systems theory and the methods offered as a tool for solving various problems, grey clustering represents one of the major instruments that can be used for the proper classification of the analyzed objects into clusters based on various evaluation rules (Xie et al. 2019). As grey systems theory offers good results when only a small amount of data is available, it has been the first choice of many researchers interested in solving problems in various research fields (Delcea 2015). Owing to its advantages over time, grey systems theory has been used in various economic research areas (Shi et al. 2020; Nguyen et al. 2020; Jalali and Heidari 2020; Yu et al. 2021). To prove the advantages of grey clustering in a series of applications, we provide a brief literature review with a focus on papers written in the economic field.
In economics, grey clustering has been successfully applied in the development of a model designed to represent the goals of the family enterprises’ successors (Więcek-Janka et al. 2020). Więcek-Janka et al. (2020), for instance, confirm that the proposed model can effectively predict the successors able to work in high-level positions within the family businesses.
As for portfolio selection, Hsu (2014) considers four risk indicators and a series of financial ratios to evaluate the performance of 62 companies from the optoelectronic domain. Using the analysis as a basis, Hsu divided the companies into three main categories—low-risk, moderate-risk, and high-risk—and extracted the most important indicators that could affect the financial health of the considered companies. Hsu concluded that the proposed approach can be successfully used by investors and creditors to evaluate the companies’ financial and operating performance (Hsu 2014).
Other applications include, but are not limited to: selection of key technology projects of international cooperation (Xie 2014), evaluation of regional innovation (Yuan et al. 2013), evaluation of investment risk decisions of overseas energy projects (Ke et al. 2012), measuring resilience barriers in manufacturing supply chains (Rajesh 2018), evaluation of the risk of agricultural drought disaster (Luo et al. 2020), evaluation of tourism development areas (Tang and Xie 2019), and evaluation of corporate sustainability (Karimi and Hojati 2021).
The reader can further consider Dong et al. (2018) for a comprehensive overview of the applications of grey clustering and the works of Xie et al. (2019), Liu and Lin (2011), Su and Xie (2018), and Liu et al. (2015) for practical examples accompanied by step-by-step explanations on solving such problems when dealing with grey clustering.
Liu et al. (2020) opened up new research directions in grey systems theory, whereas Tao et al. (2022) provide a bibliometric analysis of grey systems theory in engineering. Liu et al.’s (2022b) study also highlights the advances made in the grey systems theory in science and engineering; the authors used the ISI Web of Science database and identified 774 papers containing the “grey cluster” word combination and 557 papers containing the “grey clustering” word combination when analyzing a time-frame equal to 38 years, 1982–2020. Using a shorter timeframe of 10 years, 2011–2021, Hu and Liu (2022) discussed papers featuring grey systems theory in sustainable development research, demonstrating that grey clustering is among the most used methods from grey systems theory.
Methodology
In the first part of this section, we describe the construction of the market friction index. Next, we discuss the grey clustering method. With the values of the whitenization weight functions for each metric and cluster, the stock exchanges of the 15 post-communist East European countries are further analyzed in the next section. The steps needed to achieve the results of the grey cluster analysis and the division of the considered stock exchanges into the three categories are depicted in Fig. 1.

Steps involved in the analysis
Construction of the market frictions index
The purpose of MFI is to consider factors that can affect the integration of information into prices. In other words, it considers the market conditions that impede investors from reacting to newly available information on the market. The four major components of the index are listed in Table 1. The financial literature has developed some requirements for measuring market quality. The third columns of Tables 2, 3, 4 and 5 provide examples of these studies. For each component of the index, a set of criteria is defined with the purpose of determining the level of the index for each market, accounting for the “frictions.” These criteria represent a set of minimal requirements that should be considered when evaluating the level of friction in a market. Based on the information available to the informed person who makes the evaluation, other aspects can be considered based on personal considerations (e.g., environmental, social, and corporate governance issues). An advantage of this methodology is that it can be tailored for each investor; investors can include other specific conditions in the construction of the index.
The values of each component in Table 1 vary from one country to another based on market conditions. If a country has more than one stock exchange, the level of the index components may vary from one exchange to another.Footnote 3 We now present the construction of each of the components of the MFI index ("Available information (I1)"–"Liquidity on the market (I4)" sections).
Available information (I1)
Reliable (not too costly) information is crucial for integrating information into prices. In emerging countries, the level of information made available by markets often fluctuates, and it is not difficult to imagine why this creates confusing situations for investors.
Therefore, we create a proxy for the information available in a market at a certain point by constructing a transparency index (TI). It is calculated for each stock exchange by determining whether important information is provided through its website. For instance, Anghel et al. (2020) show that stock exchange schedule changes impact the methodology used for calculating intraday returns (see I1SE for the third criterion). We also consider whether other crucial information is publicly available (taxation levels, fees used in the capital market, presence of restrictions for foreign or domestic investors, etc.). At this point, it is important if the majority of the public has access to information, and not if it presents a favorable situation for traders.
The quality of the market decreases if the access to publicly available information diminishes. Therefore, a higher TI leads to a higher market friction index. The criteria for this index were classified into five groups based on the institution to which it is linked: stock exchange, financial asset issuer, state, recognized intermediaries, and others (see "Indexes for market frictions" section). Table 2 summarizes the criteria used for each group.
For most criteria, if information is provided on the stock exchange’s website, the market is awarded one point; it is awarded zero points otherwise. An exception is the group of criteria in which the supplier is an issuer of financial assets (I1Is). For these, we analyzed the information present on the website of each company and awarded one point if the information was presented there and zero otherwise. Based on this analysis, the value of the index for a market is between 0 and 1 and represents the percentage of issuers that offer the information analyzed. Only issuers from the first category of the stock exchange are included in the analysis because they must fulfill certain requirements to be considered the most liquid and transparent.
It would be considerably easier for a potential investor to analyze a market if all the information was provided on the same trustworthy Internet site, namely, a stock exchange. If this is the case, one point is added to the index value, and thus, the TI will increase.
Even if the level of publicly available information is sufficiently high, it is not guaranteed that a person will choose to trade in the market. Some information may make the investor avoid trading. The following index components (I2, I3 and I4) include some of the most common reasons for this decision.
Restrictions of the market (I2)
This component studies the restrictions present in the market, whether directed toward certain groups of people or certain financial assets. Table 3 lists the criteria used to construct the indices.
The first are legal restrictions related directly to the activity of stock markets, starting with the preferential treatment of domestic investors by preventing foreign investors’ access to the market.
Additionally, this component analyzes the diversity of financial assets traded in the market. If certain types of securities are missing from the capital market, potential investors will be unable to trade them. Thus, the trading strategies available to investors are restricted and may even lead to the investors not being able to trade in that market if they have a preference only for these missing financial assets. The types of securities considered to form a complete capital market are stocks, derivatives, foreign exchange, bonds, and T-bills.
Similarly, the trading methodology can impose restrictions that may prevent certain individuals from entering the market. In this context, the analysis considers factors such as the feasibility of engaging in short selling, restrictions on the daily fluctuation range of stock quotes, and the availability of foreign securities in the market. Although some of these measures, such as limiting a stock's daily price fluctuations, are implemented to safeguard investors by constraining their potential losses on a given day, the presence or absence of these methodological aspects can also limit investors' choices within that market.
Although these are not the only possible restrictions, they are considered important because they affect a high percentage of existing investors and/or markets. For each restriction present in the market, the index takes the value of 0, and in the absence of the restriction, it takes the value of 1.
Protection of investors (I3)
The third component of the index (I3) analyzes information concerning the safety level offered to investors. Table 4 presents the details of this component. It includes issues related to the general conditions offered in the market (I3Mk), the legal protection of the investor (I3IP), and the fiscal and monetary protection of investors’ wealth (I3Tx).
The legal protection of shareholders and creditors is determined based on the index proposed by Pistor et al. (2000). I3IP was constructed by comparing the level of protection offered in a country (according to the Pistor index) with the maximum level observed in the database. If the protection offered in a country is closer to the maximum level, the level of this index is higher. A similar perspective was used for the following criteria.
A high level of dividends and capital gains taxation or transaction costs can limit or block the number of transactions. Furthermore, Fisman and Svensson (2007) proved that a rise in the rate of taxation or corruption leads to a decrease of a firm’s growth (Fisman and Svensson 2007). Thus, a high level of taxation in a market will make it unattractive to potential investors compared with other markets.
For these factors, the analysis is presented as a comparison of all markets included in the research. Presumably, a lower level of taxation leads to higher protection of investors' earnings from a certain market. Thus, the market with the lowest taxation included in the analysis registered the highest index value for this factor (closest to 1). The market with the highest taxation registers a value of zero based on the formula in Table 4. The taxation levels, both for capital gains and income, were provided by www.kpmg.com.
In addition, we analyze the cost of the information provided by the stock exchange, because paying a fee leads to a reduction in investor returns. Thus, one point was given to stock exchanges that did not impose such a fee and zero to those that did.
Another important factor is investors’ personal safety (Appel and Loyle 2012). If they do not feel safe, there is a high probability that investors will decide against sending their capital to the market. Moreover, a country’s lack of political and/or economic stability increases the risk associated with issuers from the local capital market.
Therefore, another group of factors was added to the analysis, which was concerned with the general conditions offered in a country. We consider four issues: the presence of war in the country, the restricted activity of domestic traders, wherein they were prevented from investing in other foreign markets, the annual crime rate, and perceived corruption level. For the first factor, the value of the index is 1 if no war affects the market and 0 otherwise. Similarly, if domestic traders are prevented from investing in foreign markets by legislation, the index takes the value of 0, and 1 otherwise. The level that is considered acceptable for the last two issues is subjective, but it can be assumed that a lower crime rate and corruption are positive aspects. Therefore, for these two factors, the index takes values between 0 and 1 based on the level recorded by these factors in the analyzed country compared with the other countries included in the analysis.
The development of corporate governance codes shows investors that stock exchanges are willing to provide mechanisms for protecting their wealth. The implementation of corporate governance codes proves to investors that companies are willing to maintain transparent and equitable relationships with their stakeholders. Thus, they can better protect their investments by interacting with the company management. However, corporate governance codes are already included in the first component of the index. Hence, it was not included in this component to avoid evaluating the same information twice.
Table 4 presents the criteria included in this component of the index, and the formula used to determine their values. Each takes values between 0 and 1, with 1 suggesting a high level of protection for investors' wealth and 0 a low level of protection.
Liquidity on the market (I4)
The final category of the index analyzes investors’ possibility of trading the securities they want at an opportune moment. Liquidity is defined and measured in financial literature in many ways. For instance, Chordia et al. (2008) measure illiquidity in the market using indicators such as order imbalances and ask-bid spread. However, these indicators are specific to analyses conducted on individual titles and high-frequency trading (Apergis et al. 2015; Switzer and Picard 2016). When discussing the liquidity of a market, the indicators change because they cover the entire market. Bernstein (1987) discusses some inherent problems that appear when determining the liquidity of a market and the existing debates on the usefulness of some proxies. According to Lesmond (2005), it is difficult to offer a unique definition and estimation method for liquidity because it can be connected to different firm-specific properties (e.g., bid-ask spread) or market-level development (e.g., trading volume); however, liquidity-generated costs vary significantly between markets, with higher levels linked to countries with weak political and legal institutions.
Different indicators can be chosen as proxies for market liquidity, given the perspective of the analysis (market viewed as a whole and analyzed for low-frequency data annually): the average volume of transactions per day, the average number of transactions per day, the number of traded companies (% of the number of listed companies), market capitalization, etc. In this study, the following indicators were considered: the number of listed companies in a market (also used by Karolyi (2015) as a market capacity indicator), market capitalization (% of GDP) (also used by Karolyi (2015) as a market capacity indicator), average daily volume of transactions, average daily number of transactions, and average daily traded amount.Footnote 4
Although most investors would agree that they want to invest in markets with high liquidity, it is difficult to determine an acceptable level for any liquidity indicator. Thus, we chose to determine the level of this component by comparing it with the other markets included in the analysis in a manner similar to those previously presented.
If the market liquidity is low, there is lower chance of trading at the desired moment. Therefore, we consider that an increase in liquidity leads to an increase in market quality. The criteria considered are presented in Table 5, along with the formula used to determine them. The values range from 0 to 1; a level closer to 1 signifies higher market liquidity.
Construction of the whitenization weight functions for grey clustering
Let us now consider the construction of the whitenization weight functions (Li et al. 2012; Liu et al. 2017; Luo and Huihui 2019), which will help us conduct the grey clustering analysis. We also present the specific values determined for our case, that is, the selected post-communist East European capital markets.
As Liu et al. (2017) mentioned, grey clustering based on whitenization weight functions is more suitable for problems with poor information. When employing the clustering method, particularly when determining the possibility functions, the values of the turning points can be established by considering the objects to be clustered based on similar objects that can be found in the system and are not necessarily involved in the clustering process (Liu et al. 2017). Therefore, when establishing the form of the whitenization weight functions, there is a certain degree of subjectivity, which is mainly related to the experience of experts. This concept was reiterated by Mi et al. (2012) and Xie et al. (2019) in their paper.
In this study, we used the linear whitenization weight function, as it is the most commonly employed type of whitenization weight function in the papers published in the literature (Liu and Forrest 2011; Qiu et al. 2015; Liu et al. 2017; Liu and Yang 2017; Mustajib et al. 2021). We have considered only one instance of data that has been extracted; hence, we assume that the linear whitenization weight functions better fit the considered situation. In the case where the dynamicity of the considered metrics could have been extracted in real time, one could have opted for the grey nonlinear clustering approach, as Mi et al. (2012) did in the case of a trustworthy software evaluation.
General aspects
Consider n objects to be clustered according to m cluster criteria into s grey classes. The grey clustering method, through which the observed values of the ith object at the jth criterion are classified into the kth grey class, with i = 1, 2, …, n, j = 1, 2, …, m, and k = 1, …, s is performed as suggested by Li et al. (2012) and Liu et al. (2017).
The whitenization weight function of the kth subclass of the j-criterion class, denoted as \(f_{j}^{k} \left( \cdot \right)\), can take various forms as discussed in the following (Li et al. 2012; Liu et al. 2017). If the whitenization weight function takes a typical form, as shown in Fig. 2, the function can be written as
where \(x_{j}^{k} \left( 1 \right)\), \(x_{j}^{k} \left( 2 \right)\), \(x_{j}^{k} \left( 3 \right)\) and \(x_{j}^{k} \left( 4 \right)\) represent the turning points of the function \(f_{j}^{k} \left( \cdot \right)\). When the value of \(x\) increases between \(x_{j}^{k} \left( 1 \right)\) and \(x_{j}^{k} \left( 2 \right)\), the probability that the object is classified as belonging to the current cluster increases. In the case in which \(x\) is between \(x_{j}^{k} \left( 2 \right)\) and \(x_{j}^{k} \left( 3 \right)\), the value of the function is 1; thus, the object has the maximum chance of being assigned to the current cluster. Finally, when the value of \(x\) varies between \(x_{j}^{k} \left( 3 \right)\) and \(x_{j}^{k} \left( 4 \right)\), the probability of the object being assigned to the current cluster decreases gradually.

Typical form for the whitenization weight function
Depending on the presence or absence of certain turning points, different variants of the function \(f_{j}^{k} \left( \cdot \right)\) are possible (Liu et al., 2017; Li et al. 2012):
-
Whitenization weight function of the lower measure (Fig. 3):
$$f_{j}^{k} \left( x \right) = \left\{ {\begin{array}{*{20}l} {0,} \hfill & {x \notin \left[ {0, x_{j}^{k} \left( 4 \right)} \right]} \hfill \\ {1,} \hfill & {x \in \left[ {0,x_{j}^{k} \left( 3 \right)} \right]} \hfill \\ {\frac{{x_{j}^{k} \left( 4 \right) - x}}{{x_{j}^{k} \left( 4 \right) - x_{j}^{k} \left( 3 \right)}}} \hfill & {x \in \left[ {x_{j}^{k} \left( 3 \right),x_{j}^{k} \left( 4 \right)} \right]} \hfill \\ \end{array} } \right..$$(2)Fig. 3 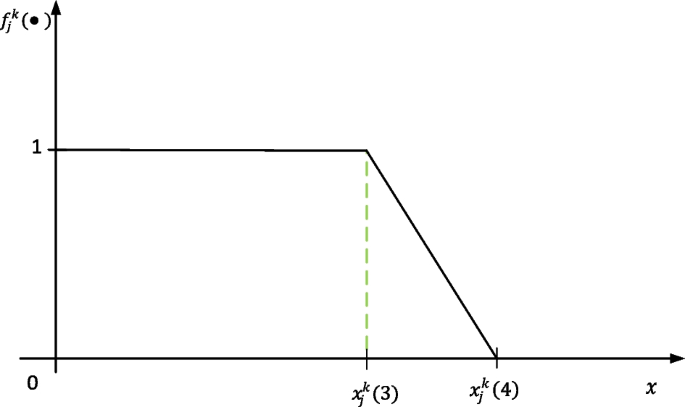
Whitenization weight function of the lower measure
-
Whitenization weight function of the upper measure (Fig. 4):
$$f_{j}^{k} \left( x \right) = \left\{ {\begin{array}{*{20}l} {0,} \hfill &\quad {x < x_{j}^{k} \left( 1 \right)} \hfill \\ {\frac{{x - x_{j}^{k} \left( 1 \right)}}{{x_{j}^{k} \left( 2 \right) - x_{j}^{k} \left( 1 \right)}},} \hfill &\quad {x \in \left[ {x_{j}^{k} \left( 1 \right), x_{j}^{k} \left( 2 \right)} \right]} \hfill \\ {1,} \hfill &\quad {x \ge x_{j}^{k} \left( 2 \right)} \hfill \\ \end{array} } \right..$$(3)Fig. 4 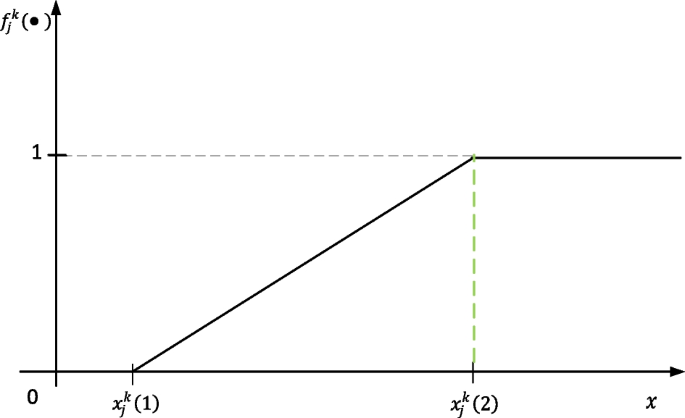
Whitenization weight function of the upper measure


Another variant of the whitenization weight function is the whitenization weight function of the moderate measure, which is not presented in this paper because it has not been used to construct the functions. Readers may refer to prior literature for further information (Liu et al. 2017; Li et al. 2012).
Whitenization weight functions
The whitenization weight functions were built for each of the four indicators considered, as presented in Table 6. When determining the values of the turning points, we started with the values of the four metrics recorded for all markets in the analysis. In the following section, we describe how the values listed in Table 6 were obtained. For a better understanding, we have exemplified the values of the I2 metrics. We chose this matrix as an example because the values recorded for I2 (provided in Table 7) are integers, and the turning point values can be easily calculated.
For each of the four metrics, we first observed the lower and the upper limit when considering all 14 post-communist East European countries; these values represent the first and last turning points for the whitenization weight function of lower and upper measure, respectively. For example, in the case of I2, the recorded values range from 3 to 9. Therefore, the first turning point for the lower measure function (\(f_{2}^{3}\)) is 3, whereas the last turning point for the upper measure function (\(f_{2}^{1} )\) is 9, as shown in Table 6. The remaining values for the lower and upper measurement functions (characterizing clusters A and C) were determined by dividing the interval between the higher and lower registered values into three equal parts, as we intended to form three clusters. Considering the case of I2, the difference between the highest and lowest values was 6 (9 − 3 = 6). This difference was multiplied by 0.33, which yielded 1.98. This was added to the lowest value (3), giving us 4.98, which was the second turning point of the \(f_{2}^{3}\) function.
Proceeding in a similar manner, by multiplying the difference by 0.66 and adding it to the lowest value, 3, we obtain 6.96, which represents the lower turning point of the \(f_{2}^{1}\) function. As the boundaries of the three whitenization weight functions through which an object is classified in a cluster based on a particular metric have been arbitrarily chosen, and as the final classification of the objects depends on four metrics, we created a function for cluster B by allowing it to slightly overlap the functions for clusters A and C. This decision is in line with the literature (Xie 2014; Guan et al. 2015; Dong et al. 2018). As Guan et al. (2015) state, in a clustering situation, one can encounter an overlap between two classes but never between three or more clusters. The area in which two classes overlap can be interpreted as a zone in which the value of the considered indicator might suggest that the object under investigation can belong to two classes at the same time. Knowing that the final clustering of an object is determined based on multiple criteria (not just one), the object is included at the end of the analysis in a single cluster based on its performance in relation to the other considered indicators. As a result, the first and fourth turning points for the whitenization weight function for Cluster B were determined by multiplying the difference found above by 0.23 and 0.76, respectively, and adding it to the smallest value. For \(f_{2}^{2}\), we have 6*0.23 + 3 = 4.38, and 6*0.76 + 3 = 7.56, respectively, as shown in Table 6.
To determine the values of the second and third turning points of the \(f_{2}^{2}\) function, we divide the interval described by the first and fourth turning points of the \(f_{2}^{2}\) function into equal parts. In the case of I2, the length of the interval between the fourth and the first point is 7.56 − 4.38 = 3.18. By dividing the length into three equal parts, we obtained a value of 3.18/3 = 1.06. This value is added to the value of the first turning point of the \(f_{2}^{2}\) (4.38) and we obtain 5.44, which is the value for the second turning point. Adding an more 1.06 to the second turning point, we obtain the value of the third turning point, that is, 6.50, as shown in Table 6. The same logic is used to determine the whitenization weight functions for the other three metrics.
The values selected to construct the functions were determined based on the values presented above for each indicator. Three clusters were considered: cluster A (k = A) corresponds to the post-communist East European capital markets recommended without reserve; cluster B (k = B) comprises all the post-communist East European capital markets recommended with some reserve, whereas cluster C (k = C) contains all the post-communist East European capital markets not recommended according to the importance given to each of the metrics.
Data
The estimations of the indicators for the MFI are employed for 14 post-communist East European Countries: Bosnia–Herzegovina, Bulgaria, Croatia, Czechia, Estonia, Hungary, Latvia, Lithuania, the Republic of Moldova, Poland, Romania, Serbia, Slovakia, and Slovenia.Footnote 5 In the case of Bosnia–Herzegovina, the country's stock exchanges Banja Luka (Bosnia1) and Sarajevo (Bosnia2) were analyzed.
Several indicators provided by different institutions were used to determine the levels of the indices. We started with the information provided by the stock exchange websites related to the daily values of the stock indices and stocks from the first tier, which are considered the most liquid. We also considered information concerning the regulation and organization of these capital markets, market members, and market liquidity. At the same time, we determined whether accessing the information required the payment of fees.Footnote 6
The information provided by first-tier companies on their websites was investigated. Based on this information, the levels of component I1Is were calculated. If the market organization did not provide this specific classification, we considered the companies included in the index of most liquid stocks. For example, in Poland, issuers were classified by stock exchange based on their market capitalization, not their liquidity. Hence, we consider companies that form the WIG 30 index, which contains "the 30 major and most liquid companies on the WSE Main List".Footnote 7 In addition, the websites of the members recognized by the market were analyzed to determine whether they provided information concerning the level of the trading fee they used for specific transactions in the market. Both this analysis and an analysis of the websites of issuers from the first tier were conducted using the English versions of their sites. If not available, Google Translate was used to search for a series of keywords in the annual reports of issuers that were provided in their national language.
The World Bank Database provides a series of other indicators: the number of listed domestic companies in a market and GDP. The first indicator is considered in our analysis only if the website does not provide information about the total number (domestic and foreign) of listed companies. The GDP level is necessary to determine the percentage of market capitalization in the GDP. The indicators concerning the liquidity of the market were calculated in the same currency, the Euro, in a manner similar to those previously presented. We use currency exchange rate values provided by the European Central Bank (www.ecb.europa.eu).
Most information concerning market restrictions was obtained from regulations provided by stock exchanges. Data on legal restrictions imposed on foreign investors were obtained from reports provided by www.lexmundi.com/guidestodoingbusiness. The restrictions on national investors investing in international markets were determined through information provided by stock exchange sites. If missing, the conditions offered by the recognized market intermediaries for their services were analyzed. If these conditions do not include restrictions on national investors, we assume that there are no restrictions on the market.
To determine the third component of investor protection, we used a series of sources. The legal protection of shareholders and creditors was provided by the index of Pistor et al. (2000). The crime rate was determined using the United Nations Office on Drugs and Crime report, available at www.unodc.org/gsh/en/data.html. We used www.warsintheworld.com to determine whether the countries in our analysis were involved in war. The taxation levels for both capital gains and income were provided by reports at www.kpmg.com. Slovenia and the Republic of Moldova were not present at this site; therefore, we used data provided by www.taxerates.cc. The corruption level was derived from the results of the Corruption Perception Index provided by Transparency International, www.transparency.org/research/cpi.
We selected 2012 as the temporal reference point. This year proved to be problematic for the development of most countries in the analysis, as shown by the GDP growth in Fig. 5. After 2009, when the effects of the global crisis became visible, the markets seemed to recover. However, the growth rate in 2012 was lower than the average GDP growth rate for most of the countries (with the exception of Latvia) and negative in some cases. Therefore, choosing this year for the analysis was meant to help us observe market conditions at difficult but not catastrophic moments. It provides an image of capital markets' conditions to attract investors in times of high demand and low funding supply.

GDP evolution for the selected countries in 2000–2020
Results
This section presents the main results of the study. First, the level of the proposed index is presented. Second, we use grey clustering to rank the capital markets analyzed.
Market friction indexes (MFI) in 14 post-communist East European countries
The results obtained for the 15 post-communist East European stock exchanges (14 countries with two stock exchanges in Bosnia and Herzegovina) in 2012 are presented in Table 7. The values of the index vary considerably between the analyzed markets, recording a minimum of 21.07 points (in the Republic of Moldova) and a maximum of 36.19 points (in Hungary). None of these markets work perfectly with no friction (the level of the index would have been 42 points if there was no friction). Thus, the organization and development of markets can be improved.
Our recommendation to an investor who decides to invest in East Europe is to also analyze these markets individually, not only as a group. This is because the results show that their conditions differ significantly, in accordance with the results of Dragotă and Ţilică (2014).
An investor can rank these markets from the highest to the lowest level of the index and choose which markets offer sufficient conditions to invest in. Presumably, they will prefer those with a low friction level while avoiding those most affected by friction. However, additional information can be obtained through an analysis of the index's components, which could lead to different decisions depending on the specific demand of the investor (e.g., whether the investor is interested in buying foreign assets).
For example, based on the index, liquidity appears to be the factor that creates the most problems in the analyzed markets. Therefore, investors who decide to participate in the market should pay attention to the risk of having no counterparties when they want to sell. Some markets such as Hungary, Czechia, and Poland have higher levels of liquidity. These countries also recorded high values for other components, making them good candidates for international portfolios.
However, markets such as the Republic of Moldova, Estonia, Latvia, and Lithuania show an extremely low level of liquidity. The first has a small stock exchange with limited development. This can also be seen in the low index levels of the other components, particularly the transparency level. The last three markets are part of the NASDAQ OMX (https://nasdaqbaltic.com) group of stock exchanges, leading to a similar level of transparency. Even if liquidity is reduced, based primarily on the small number of listed companies, the levels of the other components of the index appear to be satisfactory. Thus, the analysis based on the four components of our index is valuable in some cases and should be performed alongside the analysis of the total value of the index to observe the entire situation.
Because the analysis of the four components can provide important insights into the decision-making process, it should not be based solely on observing the obtained values. We recommend using a more objective econometric-based approach, such as the grey clustering method, which also allows us to include the specific demands of different investor categories (see "Grey clustering" section).
Grey clustering
Four main situations were considered and analyzed using the Modeling System of Grey Theory 6.0 software (Bo et al. 2011; Liu et al. 2017). For each situation, different importance was given to each of the four indices considered in the analysis, formally noted above as I1–I4. The need to consider these situations is inspired by the economic situation in which different types of decision-makers can be encountered, who can rely more on some indicators and less on others while making their decisions. The form of the whitenization weight functions remained the same as that presented in Table 6, whereas the values of the weights changed accordingly for each considered case. The new values for the weights were provided as inputs in the Modeling System of Grey Theory software (version 6.0). The results of the selected scenarios are presented and discussed below.
Situation 1: equal importance given to the four considered indices
In this case, the weights for each of the four types of metrics—namely I1: available information; I2: restrictions of the market; I3: protection of investors and I4: liquidity on the market—are equal, each indicator contributing with a quarter to the result (\(\eta_{1} = \eta_{2} = \eta_{3} = \eta_{4} = 0.25).\) In this case, the investor relies on good results for all four indices, offering them equal importance when making decisions without supplementary requirements. The data in Table 8 were obtained based on grey clustering analysis.
Based on the grey clustering analysis, Cluster A, which corresponds to the post-communist East European capital markets recommended without reserve, is composed of seven stock exchanges. As a result, an investor interested in capital markets with good performance in all four indicators, I1–I4, can consider Cluster A as a potential capital market investment. An investor interested in having a more diversified portfolio among capital markets can also consider those listed in cluster B but with some reservation. Capital markets listed in Cluster C should be avoided by an investor who prefers all four indices to have similar ranking.
Situation 2: equal importance given to the underlying components of the four indices
In this situation, the contribution of each index component to the final result is set in accordance with the number of requirements used in the development process described in "Methodology" section. A total of 35 criteria were identified, 20 of which were included in the I1 index, contributing 57.14% to I1 in the result. Similarly, I2 comprises three criteria, which lead to an 8.57% contribution from I2 to the result. I3 embodies eight criteria representing 22.86%, whereas I4 contains four criteria equivalent to 11.43% contribution to the results. Thus, this analysis considers the situation for each individual criterion included in the MFI, and not the inclusion in one index or in another (which can be considered more disputable).
The results for this scenario are presented in Table 9. Estonia, Latvia, Lithuania, Croatia, Hungary, and Slovenia are included in the cluster of post-communist East European capital markets recommended without reserve, whereas Romania, Bulgaria, Poland, Czechia, and Slovakia are recommended with some reserve. Comparing the results with the previous situation, three of the four stock exchanges listed in Cluster C are the same: Bosnia2, the Republic of Moldova, and Serbia.
Situation 3: higher importance to one of the indicators
In this case, one of the indicators contributes 60% of the results, whereas the other three indicators account for the remaining 40%. As a result, four situations emerge.
Situation 3.1: higher importance given to I1
Investors who make investment decisions based on these results are interested in investing in capital markets for which the quantity of available information is high, while other aspects such as market restrictions, investor protection, and market liquidity are considered, but to a lesser extent. The values for the weights are as follows: \(\eta_{1} = 0.60\), \(\eta_{2} = 0.1333\), \(\eta_{3} = 0.1333\), \(\eta_{4} = 0.1333\).
Based on the results in Table 10, most of the stock exchanges are listed in the without-reserve cluster (A) or with-reserve cluster (B), except for the Bosnia2 and Republic of Moldova capital markets, which are not advisable for investors interested mainly in the availability of information.
Situation 3.2: higher importance given to I2
In this case, investors are primarily interested in market restrictions (I2) and, to a lesser extent, in the other three indicators (I1, I3, and I4). The values for the weights are \(\eta_{1} = 0.1333\), \(\eta_{2} = 0.60\), \(\eta_{3} = 0.1333\), and \(\eta_{4} = 0.1333\).
Even in this case, most of the capital markets are divided between the “without reserve” cluster (A) or “with reserve” cluster (B) (see Table 11). The Republic of Moldova is the only country listed in Cluster C, corresponding to capital markets in which an investor interested in the market’s restrictions should not invest.
Situation 3.3: higher importance given to I3
The results in Table 12 are obtained for investors who have wealth protection as a main indicator in selecting capital markets while placing less importance on the other three indicators. The values for the weights are \(\eta_{1} = 0.1333\), \(\eta_{2} = 0.1333\), \(\eta_{3} = 0.60\), and \(\eta_{4} = 0.1333\).
Even in this case, most capital markets are divided between Clusters A and B. Cluster 3 comprises three capital markets: Bosnia2, the Republic of Moldova, and Serbia.
Situation 3.4: higher importance given to I4
If investors are primarily interested in market liquidity, the results in Table 13 should also be considered. The values for the weights are \(\eta_{1} = 0.1333\), \(\eta_{2} = 0.1333\), \(\eta_{3} = 0.1333\), and \(\eta_{4} = 0.60\).
In this case, Cluster C included a higher number of markets than before. Along with some of the countries listed in some of the previous situations (namely, Bosnia2 and the Republic of Moldova), Estonia, Latvia, and Lithuania have also been included.
Situation 4: higher importance to the indicators based on the underlying components of the four considered indices
In this situation, we consider that the investor is interested in all indices incorporated in the four main indices, I1–I4. Therefore, the contribution of each index to the final result is given by the number of subcomponents among the total number of subcomponents considered. Thirteen sub-components (sub-indices) were identified, five of which were included in the I1 index, contributing 38.46% to I1. Similarly, I2 has only one subcomponent, which leads to a 7.69% contribution from I2 to the result. I3 comprised three sub-components representing 23.08%, whereas I4 had four components equivalent to 30.77% contribution to the result. The values for the weights are \(\eta_{1} = 0.3846\), \(\eta_{2} = 0.0769\), \(\eta_{3} = 0.2308\), and \(\eta_{4} = 0.3077\).
In this case, investors who make decisions based on the importance of the indicators, as specified above, are not advised to invest in the capital markets of Bosnia2 and the Republic of Moldova (Table 14).
Robustness check
We conducted a robustness analysis to reaffirm the validity of our findings. In general, robustness pertains to the ability of a clustering algorithm to maintain the consistency of its outputs across a spectrum of settings (Lu et al. 2019). The robustness check process serves as a means of assessing the stability and reliability of a clustering algorithm. Multiple methodologies can be applied to test the robustness of algorithms, which are often contingent on the quality of the generated clusters benchmarked against a classification scheme or theoretical benchmarks (Jay et al. 2012; Lu et al. 2019).
We used a two-fold approach in our analysis. First, we evaluated the robustness of the grey clustering method by employing an agglomerative approach. Second, we assessed its performance in comparison with the potential outcomes yielded by alternative clustering approaches. The subsequent section elaborates on the outcomes of both tests.
Robustness check by agglomerative approach
In this context, the grey clustering approach was employed to divide the considered countries into four distinct clusters. Our analysis sought to ascertain the degree to which, following a hierarchical approach, the countries originally assigned to each of the four clusters remained within the same cluster when transitioning from four to three clusters. To provide further clarity, we scrutinized each of the seven scenarios associated with the four aforementioned situations (Situation 1: equal importance given to the four considered indices; Situation 2: equal importance given to the underlying components of the four considered indices; Situation 3: higher importance given to one of the indicators; and Situation 4: higher importance given to the indicators based on the underlying components of the four considered indices). We subsequently derived four distinct clusters, denoted by M, N, O, and P, in which the countries were categorized. The detailed results of the clustering analysis delineating the four clusters considered are presented in Tables 15, 16, 17, 18, 19, 20 and 21.
After establishing these four clusters (M, N, O, and P), we further assessed the extent to which, when transitioning to three clusters (denoted as A, B, and C in Tables 8, 9, 10, 11, 12, 13 and 14), the countries initially assigned to the same cluster remained clustered together. Scrutinizing the results in Tables 15, 16, 17, 18, 19, 20 and 21 and Tables 8, 9, 10, 11, 12, 13 and 14 (depicted in "Grey clustering" section, grey clustering), in all seven scenarios, the countries within clusters M, N, O, and P consistently retain their positions within the same cluster when shifting from four to three clusters. In each case, the transition from four to three clusters reveals that clusters M and P encompass the same countries as clusters A and C, respectively, whereas clusters N and O coalesce into cluster B. Therefore, from this perspective, the robustness of the grey clustering algorithm is validated.
Robustness check by comparison with other clustering approaches
The alternative approach employed consisted of a k-means clustering algorithm. It represents the older and most widely-used partitional method of clustering (Sinaga and Yang 2020) and has been used in various situations in scientific literature (see (Steinley 2006) for a detailed presentation of its uses). This methodology divides a dataset into k clusters. If X = {X1, X2,…, Xn} is the dataset in a d-dimensional Euclidean space, clustering is performed by assigning each point (Xi) to a cluster that minimizes the distance to the cluster centroid. The distance for each point is determined as the sum of the squared errors (SSE) between the point and cluster centroid, considering each of the d characteristics that define the data point. The methodology consists of the following steps:
-
Step 1: Choose k as the number of required clusters.
-
Step 2: Choose the initial centroids of each cluster.
-
Step 3: Determine the SSE for each point to each cluster.
-
Step 4: Assign each point to the cluster that offers the minimum SSE.
-
Step 5: Recalculate the centroid of each cluster as the mean value of the assigned data points.
-
Step 6: Repeat steps 3–5 until convergence (data points do not migrate from one cluster to another).
This k-means clustering methodology, as opposed to grey clustering, does not permit the assignment of different weights to the d characteristics that define the data. In our study, they were represented by four components of the index (I1, I2, I3, and I4). Therefore, this methodology was employed to create four scenarios that did not require assigned weights. The four main components of the index were included simultaneously in the analysis (Scenario 1). The influence of each component was alternatively excluded, and the analysis was performed on the remaining three components:
-
Scenario 2: Analysis performed using only I2, I3 and I4.
-
Scenario 3: Analysis performed using only I1, I3 and I4.
-
Scenario 4: Analysis performed using only I1, I2 and I4.
-
Scenario 5: Analysis performed using only I1, I1 and I3.
For analysis, we divided the data into three clusters. The initial centroid for each cluster was chosen based on the values registered by our markets for the MFI to represent clusters similar to those defined in the previous sections. Thus, Cluster A’s centroid is the point with the highest index value (Hungary), Cluster B’s centroid is that with the median value (Croatia), and Cluster C’s centroid is that with the minimum value (the Republic of Moldova). The results are presented in Tables 22, 23, 24, 25 and 26.
These results are similar to those obtained from the grey clustering analysis in the previous sections. Given the different conditions required in the methodology, some variability in the results is expected; however, in most cases, the conclusions are similar. For example, the markets that are generally included in Cluster A through grey clustering (Czechia, Estonia, Hungary, Latvia, Lithuania, Poland, and Romania) are assigned the same rank through this alternative approach. This is also the case for the markets typically included in Cluster B and those in Cluster C. Therefore, this supports the robustness of the results obtained using the previously employed grey clustering algorithm.
Concluding remarks
The aim of this study was twofold: the construction of a market friction index and the clustering of capital markets based on their level of friction using grey systems analysis. First, we constructed an index to evaluate the level of friction on 15 stock exchanges from 14 post-communist East European countries in accordance with organizational efficiency levels. This index has four components: accounting for available information (I1), restrictions (I2), investor protection (I3), and market liquidity (I4). The stock exchange rankings based on the proposed index are presented in Table 27. These results may provide portfolio managers with a synthetic perspective on the friction that affects the decision-making process.
As a possible future direction of study, the proposed index could be extended to include more capital markets, either emerging or developed, to offer decision-makers information about all potentially attractive markets. Applying this methodology annually would show whether the analyzed stock exchanges tried to continually improve their market conditions: if they tailored their conditions only in specific periods (e.g., to attract new investors in difficult times) or if they were not concerned about the impact of friction.
Second, we use grey clustering analysis to group the markets into three categories: A, recommended without reserve; B, recommended with reserve; and C, not recommended. Grey clustering was chosen for the analysis because it has been proven to work well in applications with limited data. We constructed seven scenarios by assigning various levels of importance to different criteria included in the index. The results presented in Table 28 show that the four capital markets remain in the same cluster regardless of the simulated scenario. From the friction perspective, Hungary is a strongly recommended capital market for portfolio construction. Bulgaria and Slovakia can also be considered for portfolio development; however, precautions should be taken to mitigate the influence of friction. In contrast, the capital market of Republic of Moldova falls under the “not recommended” cluster in all scenarios considered.
The results for the other stock exchanges show some degree of variability. Thus, investors with different perspectives of the significance of certain frictions can adjust their investment strategies. Estonia, Latvia, and Lithuania have strong recommendations to invest, excluding the case in which the liquidity component has the highest importance (e.g., speculative traders who intend to make frequent changes in their portfolios). Czechia, Poland, and Romania can also be seen as having strong investment recommendations, with two exceptions: the situation in which the investors’ protection component has the highest influence, or when each considered criterion has the same importance. Croatia and Slovenia can also be included in the portfolio, but the influence of friction must be mitigated. The markets from Bosnia and Herzegovina appear to be strongly influenced by friction, but the Banja Luka Stock Exchange (Bosnia1) seems to be a better option than Sarajevo (Bosnia2). Serbia is the only market in the database that shows high variability in results; it can be included in the three clusters based on the considered scenarios.Footnote 8
Despite the contribution of this study to the existing literature, it has some limitations. First, the whitenization weight function is constructed based on the results we gathered in connection with the considered markets and are not compared with others for which data could have been gathered.
Second, the linear form of the whitenization weight functions was used in this study and not the nonlinear form because we used the data gathered for a particular moment of time. As Xie et al. (2019) note, in the construction of the grey clustering model, the whitenization weight function is mainly designed by researchers based on known information and is thus subjective. Even if several markets are included in the same “recommended without reserve” cluster, the portfolio manager can also consider other selection criteria. Hence, the portfolio manager could consider an optimization process, adding his/her tolerance to different types of friction to the other set of investment objectives and restrictions. The construction of this optimization model represents a future direction for the study.
Third, the structure of the index or the scenarios included in the grey analysis could be modified or enhanced to consider the perspective of certain types of investors (e.g., individual or institutional investors interested only in certain groups of markets) by applying questionnaires to various domestic and international trading individuals and institutions.
Fourth, the future evolution of the components could consider the opinions of financial analysts put forward through different online social networks. This analysis could help highlight the influence of social media on investment decisions.
Availability of data and materials
The datasets used during the current study are available from the corresponding author on reasonable request.
Notes
The existence of a fair market value (which can be different from the price) is often assumed by practitioners (see, for instance, the appraisers), but the concept is very difficult to quantify given that value is a disputable concept [thousands of years old debates can be linked to this concept; see Xenophon (362BC)]. However, the degree to which the price is affected by noise (De Long et al. 1989) and frictions (DeGennaro and Robotti 2007) can be an indicator of the possible deviation of the price from the fair market value.
These restrictions can be related to each type of investor that could be discriminated on the market.
The only exception is the third component, the one regarding the level of investors' protection, which remains constant for all stock exchanges from the same country at a particular moment in time. This happens because the component is determined based on the general conditions offered in the country and the legal framework it developed, not on some characteristics specific to the stock exchange.
Karolyi (2015, p. 53) uses turnover, measured as the value of traded shares divided by market capitalization. The author states that “it is not a direct measure of liquidity, but high turnover is expected to signal lower transaction costs.”.
Albania was initially included in the analysis. However, due to lack of trading, its stock exchange was finally excluded from this study. In 2014, the Albanian stock exchange was closed.
At the time of the analysis, most stock exchanges did not require a fee to provide the information considered in the index, with the exception of Poland, the Republic of Moldova, Serbia, and Slovakia.
This could be a result of the particularities of this capital market. The country has put in place a strong legal framework and a transparent internet site to support the development of the stock exchange, but it has important problems concerning the supply and demand of capital markets instruments (World Bank Group 2019).
Abbreviations
- BGR:
-
Bulgaria
- BIH:
-
Bosnia–Herzegovina
- Bosnia1:
-
Banja Luka Stock Exchange
- Bosnia2:
-
Sarajevo Stock Exchange
- CZE:
-
Czechia
- EMH:
-
Efficient market hypothesis
- EST:
-
Estonia
- GDP:
-
Gross domestic product
- HRV:
-
Croatia
- HUN:
-
Hungary
- LTU:
-
Lithuania
- LVA:
-
Latvia
- MDA:
-
Republic of Moldova
- MFI:
-
Index for the absence of frictions on the market (Market Frictions Index)
- PCEEC:
-
Post-Communist East European Countries
- POL:
-
Poland
- ROU:
-
Romania
- SRB:
-
Serbia
- SSE:
-
Sum of the squared errors
- SVK:
-
Slovakia
- SVN:
-
Slovenia
- TI:
-
Transparency Index
References
Aitken M, Chen H, Foley S (2017) The impact of fragmentation, exchange fees and liquidity provision on market quality. J Empir Finance 41:140–160. https://doi.org/10.1016/j.jempfin.2016.10.002
Anghel DG, Ţilică EV, Dragotă V (2020) Intraday patterns in returns on the Romanian and Bulgarian stock markets. J Econ Forecast 23:92–114
Aparicio K, Kim R (2022) External capital market frictions, corporate governance, and tax avoidance: evidence from the TED spread. Finance Res Lett. https://doi.org/10.1016/j.frl.2022.103381
Apergis N, Artikis PG, Kyriazis D (2015) Does stock market liquidity explain real economic activity? New evidence from two large European stock markets. J Int Financ Mark Inst Money 38:42–64. https://doi.org/10.1016/j.intfin.2015.05.002
Appel BJ, Loyle CE (2012) The economic benefits of justice: post-conflict justice and foreign direct investment. J Peace Res 49:685–699. https://doi.org/10.1177/0022343312450044
Atanasov V, Davies RJ, Merrick JJ (2015) Financial intermediaries in the midst of market manipulation: Did they protect the fool or help the knave? J Corp Finance 34:210–234. https://doi.org/10.1016/j.jcorpfin.2015.07.011
Avdiu B, Gruhle T (2022) Contagion and information frictions in emerging markets: the role of joint signals. J Econ Behav Organ 200:147–173. https://doi.org/10.1016/j.jebo.2022.05.020
Bernstein PL (1987) Liquidity, stock markets, and market makers. Financ Manag 16:54. https://doi.org/10.2307/3666004
Bhagat S, Bolton B (2008) Corporate governance and firm performance. J Corp Finance 14:257–273. https://doi.org/10.1016/j.jcorpfin.2008.03.006
Bo Z, Liu S, Wei M (2011) Development and application of MSGT6.0 (modeling system of grey theory 6.0) based on Visual C# and XML. J Grey Syst 23:145–154
Bushee B, Cedergren M, Michels J (2020) Does the media help or hurt retail investors during the IPO quiet period? J Account Econ 69:101261. https://doi.org/10.1016/j.jacceco.2019.101261
Chen P, Zhang C-Y (2014) Data-intensive applications, challenges, techniques and technologies: a survey on Big Data. Inf Sci 275:314–347. https://doi.org/10.1016/j.ins.2014.01.015
Chordia T, Roll R, Subrahmanyam A (2008) Liquidity and market efficiency☆. J Financ Econ 87:249–268. https://doi.org/10.1016/j.jfineco.2007.03.005
Comerton-Forde C, Malinova K, Park A (2018) Regulating dark trading: order flow segmentation and market quality. J Financ Econ 130:347–366. https://doi.org/10.1016/j.jfineco.2018.07.002
Dasilas A, Grose C (2019) Valuation effects of tax-free versus taxed cash distributions. Int Rev Financ Anal 63:307–321. https://doi.org/10.1016/j.irfa.2018.12.013
De Bondt WFM, Thaler R (1985) Does the stock market overreact? J Finance 40:793–805. https://doi.org/10.1111/j.1540-6261.1985.tb05004.x
De Long JB, Shleifer A, Summers LH, Waldmann RJ (1989) The size and incidence of the losses from noise trading. J Finance 44:681–696. https://doi.org/10.1111/j.1540-6261.1989.tb04385.x
DeGennaro RP, Robotti C (2007) Financial market frictions. Social Science Research Network, Rochester, NY
Delcea C (2015) Grey systems theory in economics—a historical applications review. Grey Syst Theory Appl 5:263–276. https://doi.org/10.1108/GS-05-2015-0018
Delcea C, Cotfas L-A (2023) Advancements of grey systems theory in economics and social sciences. Springer, Singapore
Demirkan S, Demirkan I (2014) Implications of strategic alliances for earnings quality and capital market investors. J Bus Res 67:1806–1816. https://doi.org/10.1016/j.jbusres.2013.12.009
Djankov S, La Porta R, Lopez-de-Silanes F, Shleifer A (2008) The law and economics of self-dealing. J Financ Econ 88:430–465. https://doi.org/10.1016/j.jfineco.2007.02.007
Dong F, Qi B, Jie Y (2018) Comparative static analysis of provincial agricultural science and technology level based on grey clustering. Grey Syst Theory Appl 8:481–493. https://doi.org/10.1108/GS-05-2018-0022
Dragotă V, Mitrică E (2004) Emergent capital markets’ efficiency: the case of Romania. Eur J Oper Res 155:353–360. https://doi.org/10.1016/S0377-2217(03)00093-6
Dragotă V, Ţilică EV (2014) Market efficiency of the Post Communist East European stock markets. Cent Eur J Oper Res 22:307–337. https://doi.org/10.1007/s10100-013-0315-6
Eppler MJ, Mengis J (2004) The concept of information overload: a review of literature from organization science, accounting, marketing, MIS, and related disciplines. Inf Soc 20:325–344. https://doi.org/10.1080/01972240490507974
Fama E (1970) Efficient capital markets: a review of theory and empirical work. J Finance 25:383. https://doi.org/10.2307/2325486
Fama E (1991) Efficient capital markets: II. J Finance 46:1575–1617. https://doi.org/10.1111/j.1540-6261.1991.tb04636.x
Fama E (1998) Market efficiency, long-term returns, and behavioral finance. J Financ Econ 49:283–306
Fang J, Marshall BR, Nguyen NH, Visaltanachoti N (2021) Do stocks outperform treasury bills in international markets? Finance Res Lett 40:101710. https://doi.org/10.1016/j.frl.2020.101710
Fisman R, Svensson J (2007) Are corruption and taxation really harmful to growth? Firm level evidence. J Dev Econ 83:63–75. https://doi.org/10.1016/j.jdeveco.2005.09.009
Gaviria A (2002) Assessing the effects of corruption and crime on firm performance: evidence from Latin America. Emerg Mark Rev 3:245–268. https://doi.org/10.1016/S1566-0141(02)00024-9
Ghadhab I (2019) Does cross-listing in the US mitigate stock crash risk? International evidence. Int Rev Financ Anal 63:186–197. https://doi.org/10.1016/j.irfa.2019.04.007
Grossman SJ, Stiglitz JE (1976) Information and competitive price systems. Am Econ Rev 66:246–253
Grullon G, Michenaud S, Weston JP (2015) The real effects of short-selling constraints. Rev Financ Stud 28:1737–1767. https://doi.org/10.1093/rfs/hhv013
Guan Y, Liu H, Zhu Y (2015) Quantitative analysis of the cities’ innovation capacity based on grey variable weight clustering. Grey Syst Theory Appl 5:344–353. https://doi.org/10.1108/GS-03-2015-0010
Herbig PA, Kramer H (1994) The effect of information overload on the innovation choice process: innovation overload. J Consum Mark 11:45–54. https://doi.org/10.1108/07363769410058920
Hsu L-C (2014) A hybrid multiple criteria decision-making model for investment decision making. J Bus Econ Manag 15:509–529. https://doi.org/10.3846/16111699.2012.722563
Hu M, Liu W (2022) Grey system theory in sustainable development research—a literature review (2011–2021). Grey Syst Theory Appl 12:785–803. https://doi.org/10.1108/GS-05-2022-0049
Huang G-C, Liano K, Pan M-S (2022) Do IPOs outperform treasury bills? Finance Res Lett 47:102610. https://doi.org/10.1016/j.frl.2021.102610
Jacoby J (1977) Information load and decision quality: some contested issues. J Mark Res 14:569. https://doi.org/10.2307/3151201
Jacoby J (1984) Perspectives on information overload. J Consum Res 10:432–435
Jalali MFM, Heidari H (2020) Predicting changes in Bitcoin price using grey system theory. Financ Innov 6:13. https://doi.org/10.1186/s40854-020-0174-9
Jay JJ, Eblen JD, Zhang Y et al (2012) A systematic comparison of genome-scale clustering algorithms. BMC Bioinform 13:S7. https://doi.org/10.1186/1471-2105-13-S10-S7
Jiang H, Habib A, Hasan MM (2022) Short selling: a review of the literature and implications for future research. Eur Account Rev 31:1–31. https://doi.org/10.1080/09638180.2020.1788406
Karimi T, Hojati A (2021) Corporate sustainability assessment based on rough-grey set theory. J Model Manag. https://doi.org/10.1108/JM2-08-2020-0224
Karolyi GA (2015) Cracking the emerging markets enigma. Oxford University Press, Oxford
Ke L, Xiaoliu S, Zhongfu T, Wenyan G (2012) Grey clustering analysis method for overseas energy project investment risk decision. Syst Eng Procedia 3:55–62. https://doi.org/10.1016/j.sepro.2011.11.008
Khlifi F (2021) Web-based financial reporting, social media and information asymmetry: the case of Saudi Arabia. J Financ Report Account 20:994–1020. https://doi.org/10.1108/JFRA-01-2021-0008
Khwaja A, Mian A (2005) Unchecked intermediaries: price manipulation in an emerging stock market. J Financ Econ 78:203–241. https://doi.org/10.1016/j.jfineco.2004.06.014
Kim J-B, Yi CH (2015) Foreign versus domestic institutional investors in emerging markets: Who contributes more to firm-specific information flow? China J Account Res 8:1–23. https://doi.org/10.1016/j.cjar.2015.01.001
Klapper LF, Love I (2004) Corporate governance, investor protection, and performance in emerging markets. J Corp Finance 10:703–728. https://doi.org/10.1016/S0929-1199(03)00046-4
La Porta R, Lopez-De-Silanes F, Shleifer A, Vishny RW (1997) Legal determinants of external finance. J Finance 52:1131–1150. https://doi.org/10.1111/j.1540-6261.1997.tb02727.x
La Porta R, Lopez-de-Silanes F, Shleifer A, Vishny RW (1998) Law and finance. J Polit Econ 106:1113–1155. https://doi.org/10.1086/250042
La Porta R, Lopez-De-Silanes F, Shleifer A, Vishny R (2002) Investor protection and corporate valuation. J Finance 57:1147–1170. https://doi.org/10.1111/1540-6261.00457
Lefort F, Walker E (2007) Do markets penalize agency conflicts between controlling and minority shareholders? Evidence from Chile. Dev Econ 45:283–314. https://doi.org/10.1111/j.1746-1049.2007.00044.x
Lesmond D (2005) Liquidity of emerging markets. J Financ Econ 77:411–452. https://doi.org/10.1016/j.jfineco.2004.01.005
Li S, Zhong Z, He R, Ai B (2012) Application of grey clustering evaluations in coal railway transportation. Kybernetes 41:714–724. https://doi.org/10.1108/03684921211243365
Liew P-X, Lim K-P, Goh K-L (2022) The dynamics and determinants of liquidity connectedness across financial asset markets. Int Rev Econ Finance 77:341–358. https://doi.org/10.1016/j.iref.2021.10.003
Lim K-P, Brooks R (2011) The evolution of stock market efficiency over time: a survey of the empirical literature. J Econ Surv 25:69–108. https://doi.org/10.1111/j.1467-6419.2009.00611.x
Liu S, Forrest JY-L (2011) Grey systems: theory and applications. Springer, Berlin
Liu S, Lin Y (2011) Grey systems. Springer, Berlin
Liu S, Yang Y (2017) Explanation of terms of grey clustering evaluation models. Grey Syst Theory Appl 7:129–135. https://doi.org/10.1108/GS-11-2016-0046
Liu S, Yang Y, Fang Z, Xie N (2015) Grey cluster evaluation models based on mixed triangular whitenization weight functions. Grey Syst Theory Appl 5:410–418. https://doi.org/10.1108/GS-11-2014-0050
Liu S, Yang Y, Forrest J (2017) Grey data analysis: methods, models and applications. Springer, Singapore
Liu S, Lin C, Tao L et al (2020) On spectral analysis and new research directions in grey system theory. J Grey Syst 32:108–117
Liu H, Wang Y, Shi X, Pang L (2022a) How do environmental policies affect capital market reactions? Evidence from China’s construction waste treatment policy. Ecol Econ 198:107461. https://doi.org/10.1016/j.ecolecon.2022.107461
Liu S, Tao Y, Xie N et al (2022b) Advance in grey system theory and applications in science and engineering. Grey Syst Theory Appl 12:804–823. https://doi.org/10.1108/GS-09-2021-0141
Liu S, Yang Y, Forrest JY-L (2022c) Grey clustering evaluation models. In: Grey systems analysis. Springer, Singapore, pp 125–151
Lo AW (2004) The adaptive markets hypothesis. J Portf Manag 30:15–29. https://doi.org/10.3905/jpm.2004.442611
Lo AW (2005) Reconciling efficient markets with behavioral finance: the adaptive markets hypothesis. Social Science Research Network, Rochester, NY
Lu Y, Phillips CA, Langston MA (2019) A robustness metric for biological data clustering algorithms. BMC Bioinform 20:503. https://doi.org/10.1186/s12859-019-3089-6
Luo D, Huihui Z (2019) Grey clustering model based on kernel and information field. Grey Syst Theory Appl 10:56–67. https://doi.org/10.1108/GS-08-2019-0029
Luo D, Ye L, Sun D (2020) Risk evaluation of agricultural drought disaster using a grey cloud clustering model in Henan province, China. Int J Disaster Risk Reduct 49:101759. https://doi.org/10.1016/j.ijdrr.2020.101759
Maggi M, Fantazzini D (2012) Short selling in emerging markets. In: Handbook of short selling. Elsevier, pp 339–352
Malhotra NK (1982) Information load and consumer decision making. J Consum Res 8:419–430
McAfee AP, Brynjolfsson E (2012) Big data: the management revolution. Harv Bus Rev 8:1–9
Merl R, Stöckl T, Palan S (2022) Insider trading regulation and shorting constraints. Evaluating the joint effects of two market interventions. J Bank Finance. https://doi.org/10.1016/j.jbankfin.2022.106490
Mi C, Tian M, Li X (2012) Study on credibility level of trustworthy software development process based on grey nonlinear cluster. Kybernetes 41:908–919. https://doi.org/10.1108/03684921211257757
Mohan PS (2021) Violent crime and firm performance: evidence from the Caribbean. Int J Econ Bus 28:309–327. https://doi.org/10.1080/13571516.2021.1896926
Mustajib MI, Ciptomulyono U, Kurniati N (2021) A novel multi-criteria sorting model based on AHP-entropy grey clustering for dealing with uncertain incoming core quality in remanufacturing systems. Appl Sci 11:2731. https://doi.org/10.3390/app11062731
Nguyen P-H, Tsai J-F, Kumar G VA, Hu Y-C (2020) Stock investment of agriculture companies in the Vietnam stock exchange market: an AHP integrated with GRA-TOPSIS-MOORA approaches. J Asian Finance Econ Bus 7:113–121. https://doi.org/10.13106/JAFEB.2020.VOL7.NO7.113
Pedraza A, Pulga F, Vasquez J (2020) Costly index investing in foreign markets. J Financ Mark 51:100509. https://doi.org/10.1016/j.finmar.2019.100509
Petersen C, Plenborg T (2006) Voluntary disclosure and information asymmetry in Denmark. J Int Account Audit Tax 15:127–149. https://doi.org/10.1016/j.intaccaudtax.2006.08.004
Pistor K, Raiser M, Gelfer S (2000) Law and finance in transition economies. Econ Transit 8:325–368. https://doi.org/10.1111/1468-0351.00047
Qiu B-J, Zhang J-H, Qi Y-T, Liu Y (2015) Grey-theory-based optimization model of emergency logistics considering time uncertainty. PLoS ONE 10:e0139132. https://doi.org/10.1371/journal.pone.0139132
Rajesh R (2018) Measuring the barriers to resilience in manufacturing supply chains using grey clustering and VIKOR approaches. Measurement 126:259–273. https://doi.org/10.1016/j.measurement.2018.05.043
Sakemoto R (2019) Currency carry trades and the conditional factor model. Int Rev Financ Anal 63:198–208. https://doi.org/10.1016/j.irfa.2019.03.007
Shi Y, Zheng Y, Guo K et al (2020) The evolution characteristics of systemic risk in China’s stock market based on a dynamic complex network. Entropy 22:614. https://doi.org/10.3390/e22060614
Shiller R (1980) Do Stock prices move too much to be justified by subsequent changes in dividends? National Bureau of Economic Research, Cambridge, MA
Sinaga KP, Yang M-S (2020) Unsupervised K-means clustering algorithm. IEEE Access 8:80716–80727. https://doi.org/10.1109/ACCESS.2020.2988796
Sirin SM, Erten I (2022) Price spikes, temporary price caps, and welfare effects of regulatory interventions on wholesale electricity markets. Energy Policy 163:112816. https://doi.org/10.1016/j.enpol.2022.112816
Sparrow P (1999) Strategy and cognition: understanding the role of management knowledge structures, organizational memory and information overload. Creat Innov Manag 8:140–148. https://doi.org/10.1111/1467-8691.00128
Steinley D (2006) K-means clustering: a half-century synthesis. Br J Math Stat Psychol 59:1–34. https://doi.org/10.1348/000711005X48266
Su B, Xie N (2018) Research on safety evaluation of civil aircraft based on the grey clustering model. Grey Syst Theory Appl 8:110–120. https://doi.org/10.1108/GS-10-2017-0034
Switzer LN, Picard A (2016) Stock market liquidity and economic cycles: a non-linear approach. Econ Model 57:106–119. https://doi.org/10.1016/j.econmod.2016.04.006
Tang X, Xie N (2019) Research on the evaluation of tourism development potential of tea intangible cultural heritage based on grey clustering. Grey Syst Theory Appl 9:295–304. https://doi.org/10.1108/GS-12-2018-0065
Tao L, Liang A, Xie N, Liu S (2022) Grey system theory in engineering: a bibliometrics and visualization analysis. Grey Syst Theory Appl 12:723–743. https://doi.org/10.1108/GS-06-2022-0059
Todorova N, Souček M (2014) The impact of trading volume, number of trades and overnight returns on forecasting the daily realized range. Econ Model 36:332–340. https://doi.org/10.1016/j.econmod.2013.10.003
Watanabe T (2001) Price volatility, trading volume, and market depth: evidence from the Japanese stock index futures market. Appl Financ Econ 11:651–658. https://doi.org/10.1080/096031001753266939
Więcek-Janka E, Majchrzak J, Wyrwicka M, Weber GW (2020) Application of grey clusters in the development of a synthetic model of the goals of Polish family enterprises’ successors. Grey Syst Theory Appl 11:63–79. https://doi.org/10.1108/GS-12-2019-0062
World Bank Group (2019) Republic of Serbia capital market development. World Bank, Washington, DC
Xenophon (362BC) The economist. In: Transl. HG Dakyns. https://www.gutenberg.org/files/1173/1173-h/1173-h.htm. Accessed 18 Jan 2022
Xie N (2014) Grey cluster model based approach for selecting international cooperation key-technology projects. Grey Syst Theory Appl 4:463–472. https://doi.org/10.1108/GS-09-2014-0030
Xie N, Su B, Chen N (2019) Construction mechanism of whitenization weight function and its application in grey clustering evaluation. J Syst Eng Electron 30:121. https://doi.org/10.21629/JSEE.2019.01.12
Yang M, Li Y, Dong D (2023) Strategic information disclosure and the cost of equity capital: evidence from China. Finance Res Lett 51:103418. https://doi.org/10.1016/j.frl.2022.103418
Yildiz Y (2021) Foreign institutional investors, information asymmetries, and asset valuation in emerging markets. Res Int Bus Finance 56:101381. https://doi.org/10.1016/j.ribaf.2021.101381
Yu EP, Luu BV (2021) International variations in ESG disclosure—Do cross-listed companies care more? Int Rev Financ Anal 75:101731. https://doi.org/10.1016/j.irfa.2021.101731
Yu H, Ding Y, Sun Q et al (2021) Multi-scale comovement of the dynamic correlations between copper futures and spot prices. Resour Policy 70:101913. https://doi.org/10.1016/j.resourpol.2020.101913
Yuan C, Guo B, Liu H (2013) Assessment and classification of China’s provincial regional innovation system based on grey fixed weight clustering. Grey Syst Theory Appl 3:316–337. https://doi.org/10.1108/GS-10-2012-0040
Zhang Q, Zhang X, Chen D, Strange R (2022) Market discipline or rent extraction: impacts of share trading by foreign institutional investors in different corporate governance and investor protection environments. Int Rev Financ Anal 79:101965. https://doi.org/10.1016/j.irfa.2021.101965
Acknowledgements
The authors wish to thank, for their helpful comments, Andreea Iordache and the participants of the Conference of EURO Working Group for Commodities and Financial Modelling in Wien, the EMU-SSEM EuroConference International Conference on Business, Economics and Finance in Famagusta, the International Conference Financial World: Present and Outlook, Cluj-Napoca, and the International Congress of Grey Systems and Uncertainty Analysis.
Funding
This work was partially financed by CEFIMO.
Author information
Authors and Affiliations
Contributions
EVȚ: Design of the study, data collection, curated data, review, empirical analysis, and conclusion. VD: Design of the study, empirical analysis, review, and conclusion. CD: Design of the study, methodology, empirical analysis, review, and conclusion. RIT: Design of the study, curated data, review, and empirical analysis. All authors read and approved the final manuscript.
Corresponding author
Ethics declarations
Competing interests
The authors declare that they have no competing interests.
Additional information
Publisher's Note
Springer Nature remains neutral with regard to jurisdictional claims in published maps and institutional affiliations.
Rights and permissions
Open Access This article is licensed under a Creative Commons Attribution 4.0 International License, which permits use, sharing, adaptation, distribution and reproduction in any medium or format, as long as you give appropriate credit to the original author(s) and the source, provide a link to the Creative Commons licence, and indicate if changes were made. The images or other third party material in this article are included in the article's Creative Commons licence, unless indicated otherwise in a credit line to the material. If material is not included in the article's Creative Commons licence and your intended use is not permitted by statutory regulation or exceeds the permitted use, you will need to obtain permission directly from the copyright holder. To view a copy of this licence, visit http://creativecommons.org/licenses/by/4.0/.
About this article

Cite this article
Ţilică, E.V., Dragotă, V., Delcea, C. et al. Portfolio management under capital market frictions: a grey clustering approach. Financ Innov 10, 110 (2024). https://doi.org/10.1186/s40854-024-00634-2
Received:
Accepted:
Published:
DOI: https://doi.org/10.1186/s40854-024-00634-2